Analysis
Ethereum’s breach of falling wedge could see price climb to $265
After the Ethereum network saw ETH’s value drop significantly towards the end of last month, breaching its $181 support, the coin has recovered considerably, with the coin valued at around $183 at press time, above the aforementioned support. At the time of writing, ETH had a daily trading volume of around $10.9 billion and a total market cap of over $19.9 billion.
Daily chart

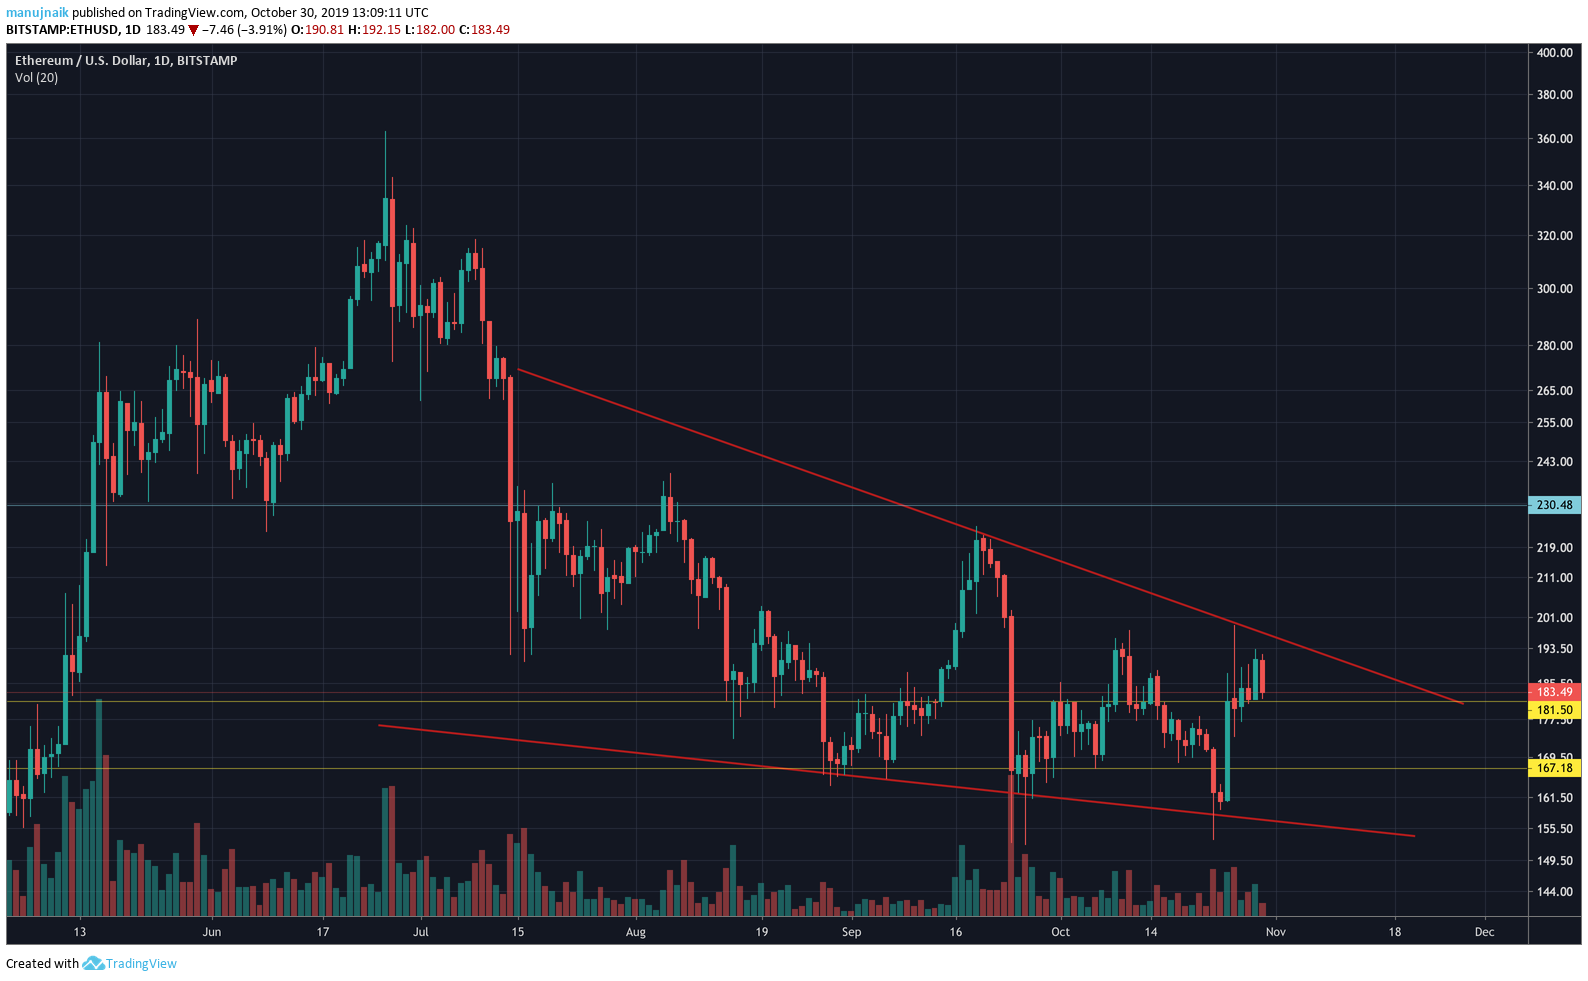
Source: ETHUSD on TradingView
The daily chart for ETH showed that the price had entered into a falling wedge pattern during the price drop in mid-July. Since then, the price has been oscillating between the trend-lines, with a possible breakout in the near future.
The decreasing trend of trading volumes further supports the theory that a falling wedge pattern is taking place.
Moving Averages
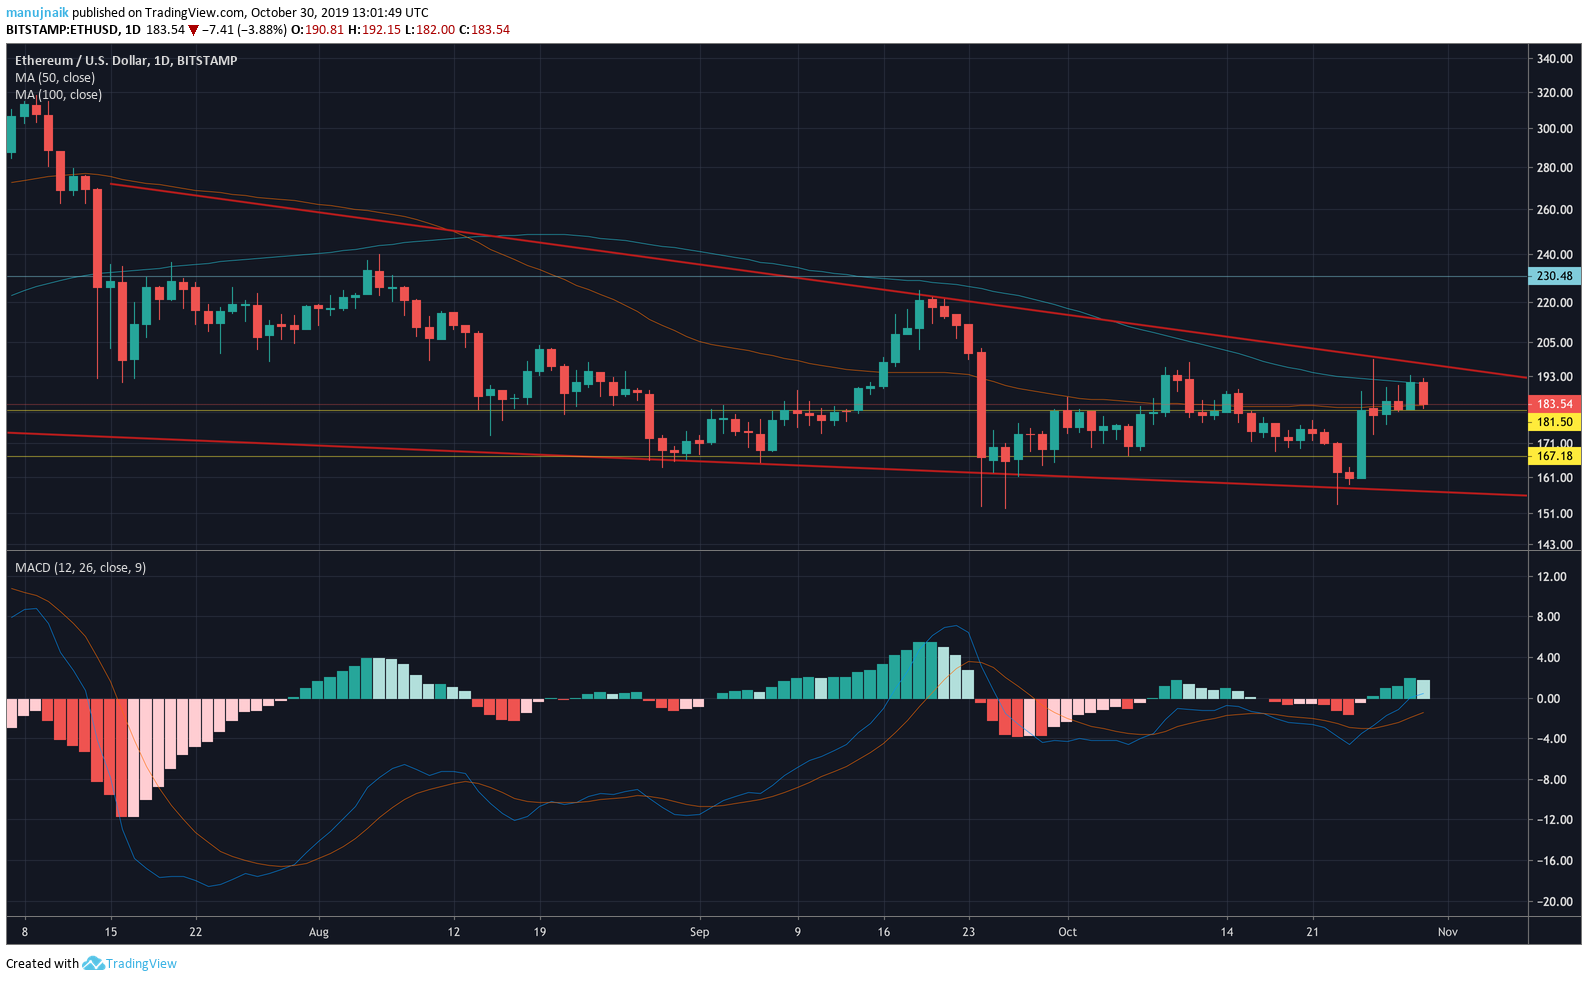
Source: ETHUSD on TradingView
While the 50-day moving average indicator looked to be moving under the price line, the 100-day moving average was just intersecting it. This could mean that the price will breach the moving average indicators as the price continues to rise.
The MACD further implied a bullish move, with the MACD line moving over the signal line. As ETH has already broken above its $167 and $181 supports, it seems likely that it will continue moving upwards.
Further, as these patterns tend to breakout around 60% of the way to the apex, where the two trend-lines meet, it is likely that the price will breach the pattern in mid to late-November. Also, as falling wedge patterns tend to breakout upwards almost 70% of the time, it is likely that ETH will continue moving up, breaching the pattern and surging to $265.


