Analysis
Ethereum’s breach of descending broadening wedge could push it down to $166
With the Istanbul hardfork scheduled to happen in 17 days, the Ethereum community is keeping its eye on the blockchain’s native cryptocurrency, ETH. Valued at around $174 at the time of writing, Ether had a market cap of more than $19 billion, with almost $8.2 billion worth of ETH traded in the last 24 hours, according to CoinMarketCap. EXX exchange handled the most amount of ETH volume traded over the period, which accounted for 3.53% of the coin’s daily volume.
Ethereum 1-hour chart

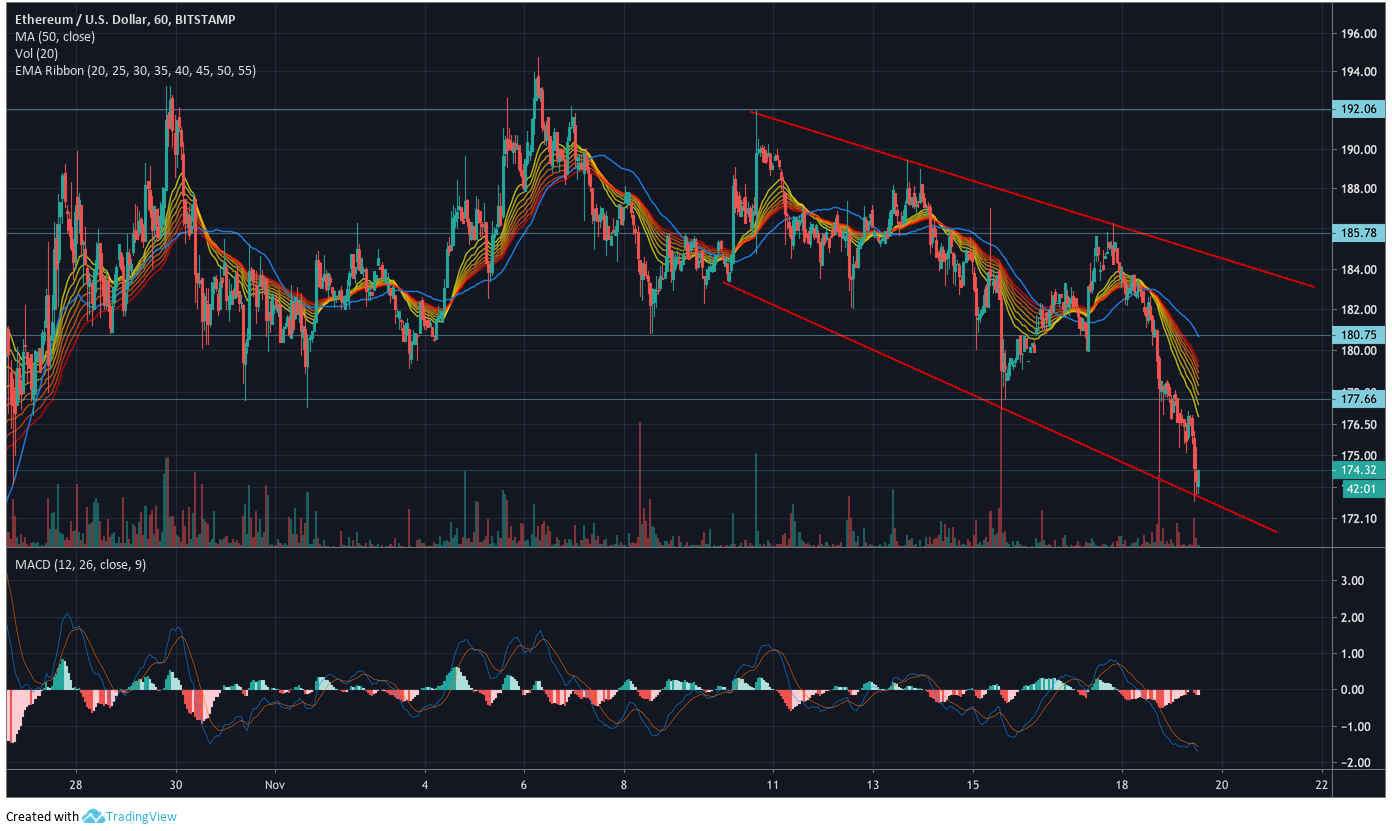
Source: ETH/USD on TradingView
The 1-hour chart highlighted that ETH had entered a descending broadening wedge towards the start of last week, with the price shuttling between the two trend lines since. The formation of a descending broadening wedge usually does not create any specific trend with regards to volume. However, the volume is said to spike as the price approaches the trend lines for a breakout.
The 50MA could be seen dipping down below the price line, indicating bearish pressure on ETH for the short-term. Further, MACD, with the signal line having recently regained its place over the MACD line, also highlighted short-term downward movement in price.
With the EMA Ribbon lines diverging over the price in response to the mean reversion that took place a day before, it is quite likely that ETH will continue moving down the pattern for the next week or so. With the price currently preparing to test the lower trend line, a spike in volume could indicate a downward breakout in the short-term.
Assuming a downward breakout happens in the next few days, ETH could drop down to values near $166. However, this kind of pattern exhibits upward-facing breakouts in 72% of cases, suggesting that ETH will likely bounce off the lower trend line, continue through the pattern, before an eventual breakout upwards to above $190 in the coming weeks.


