Ethereum, Tezos, Dash Price Analysis: 10 November

Trade volume on spot exchanges fell by 25%, while ETH Futures trade volume spiked. This implied that traders feared a correction. On the charts, Ethereum formed a symmetrical triangle that could see a breakout in the coming days. Tezos was in an uptrend but had not yet assailed an important level of resistance. Dash showed healthy buying interest fueled its recent gains and could continue to surge.
Ethereum [ETH]

Source: ETH/USD on TradingView
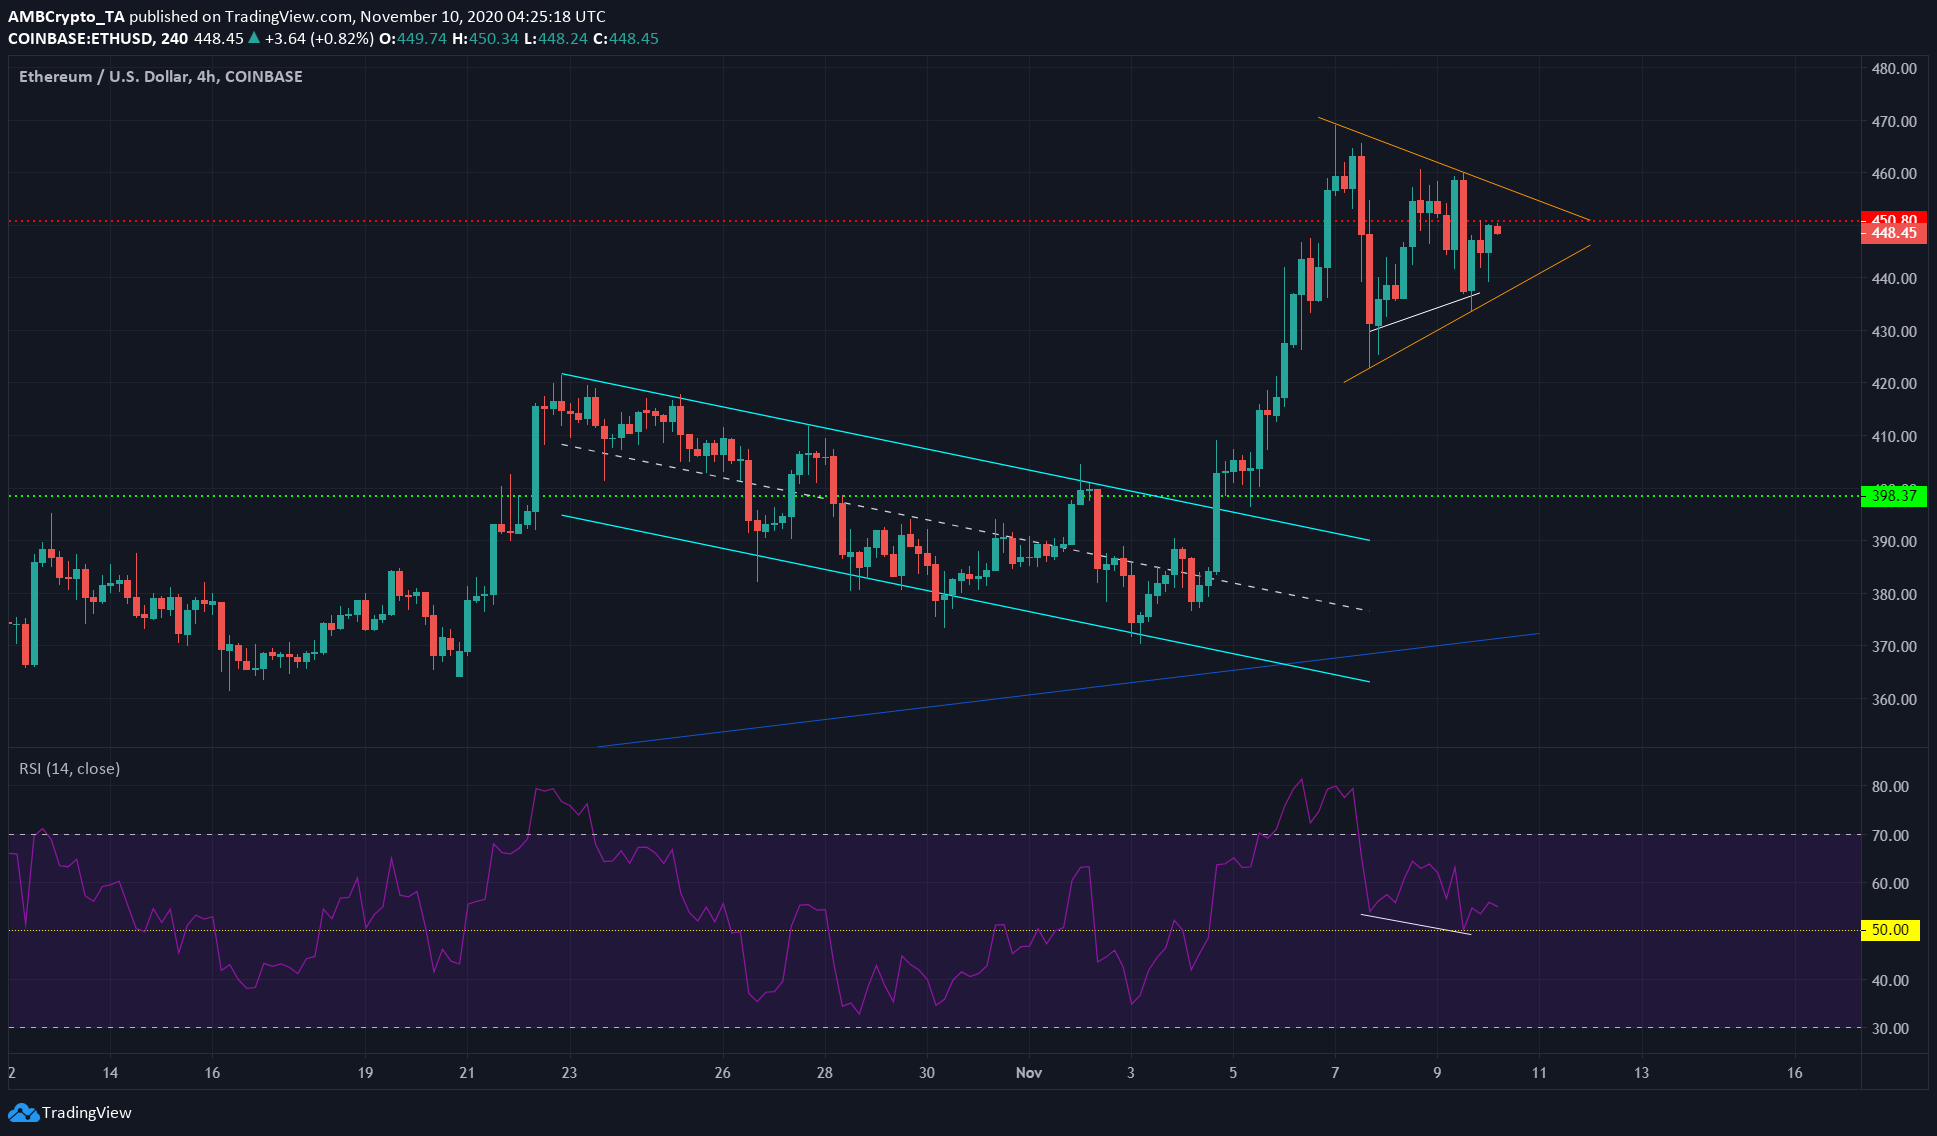
Ethereum exhibited a symmetrical triangle pattern (orange), a pattern that is generally a continuation pattern but a break to the downside can also occur.
Some further evidence for a bullish breakout was the hidden bullish divergence (white), where the price made a higher low as the momentum indicator (RSI) made a lower low.
There was a significant level of resistance at $450 that ETH needs to break above, in order to reach $480. Whether Bitcoin ascends past $16,000 in the coming days or faces a correction to the downside, would also have a large influence on ETH.
Tezos [XTZ]

Source: XTZ/USD on TradingView
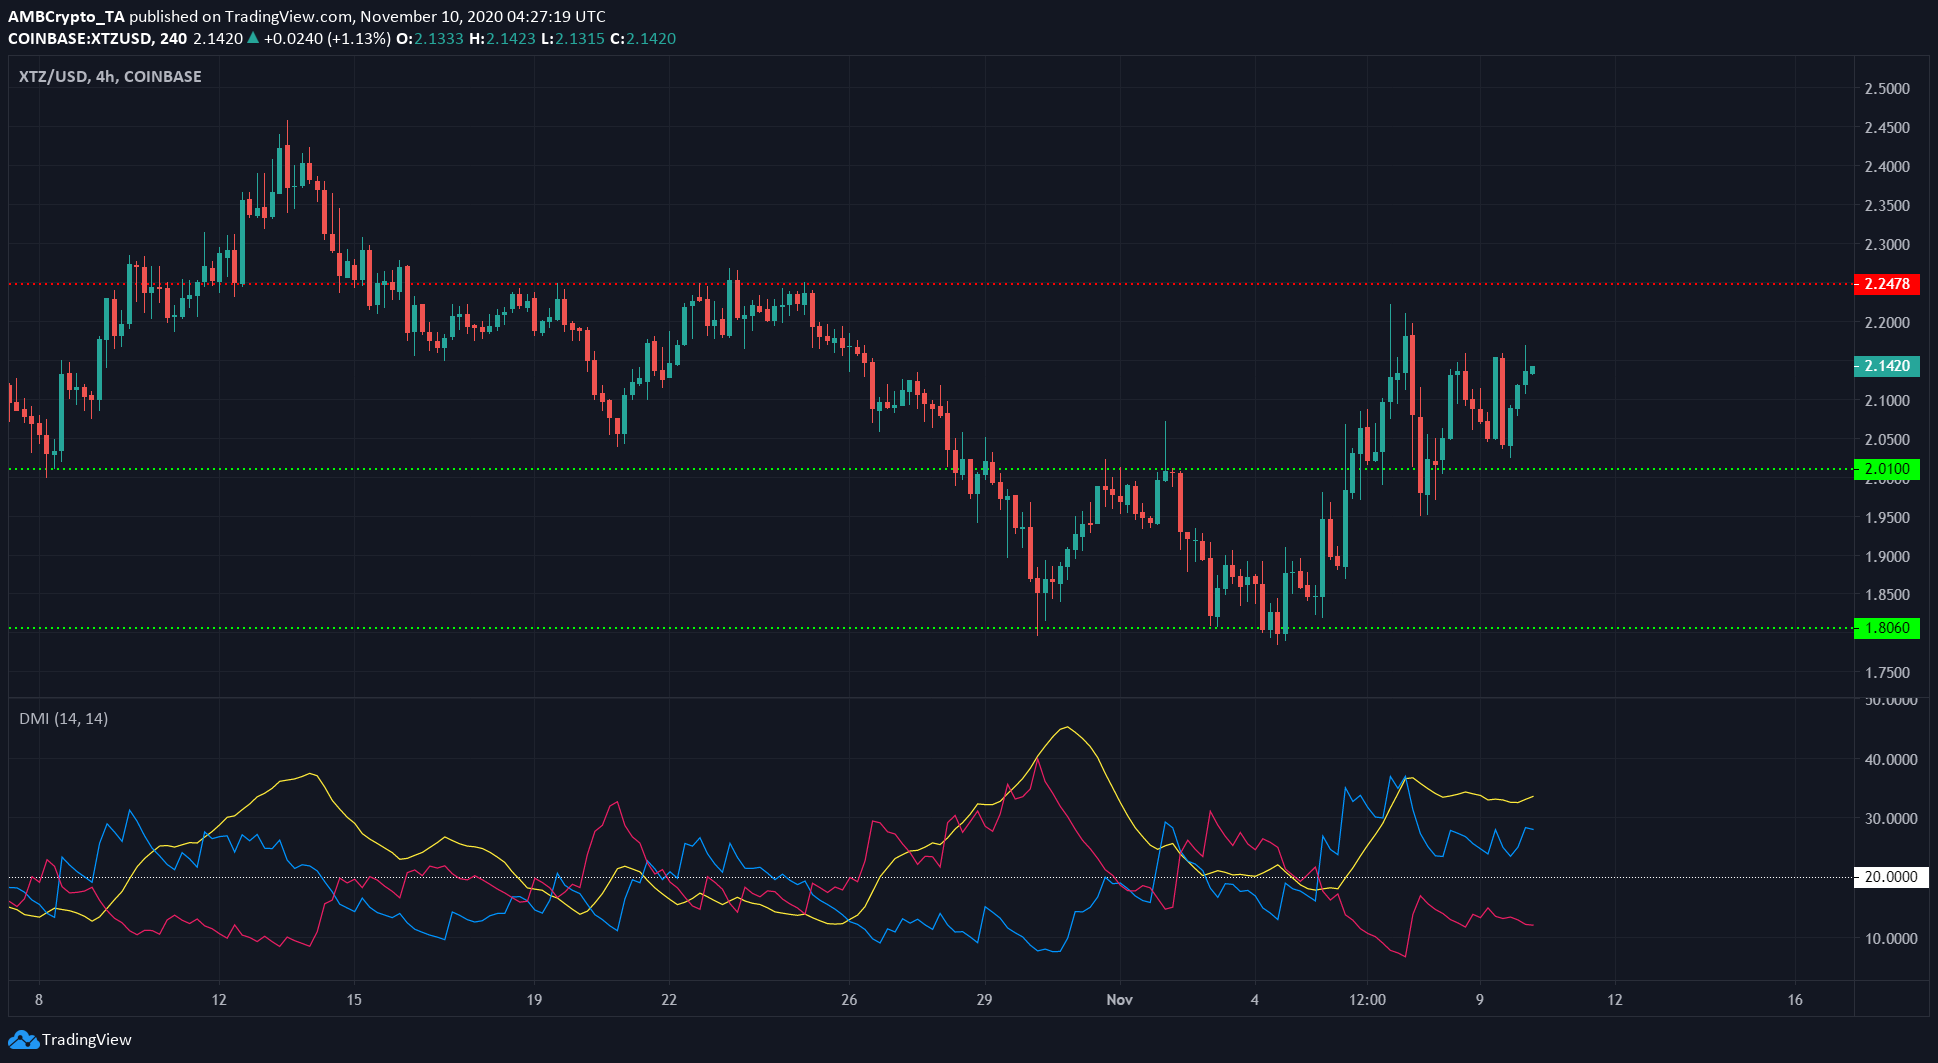
Tezos slipped beneath the $2.24 level in late September and has not been able to flip that level to support. The past week saw XTZ dip as far south as support at $1.8.
The Directional Movement Index (DMI) showed that XTZ was in a strong uptrend, as the ADX (yellow) moved above the 20 value while the +DI (blue) indicated the bullish nature of the trend.
Yet there remained a possibility that XTZ would be unable to rise past $2.24 once more, hence it would be a good level to take-profit or close long positions at.
Dash [DASH]

Source: DASH/USDT on TradingView
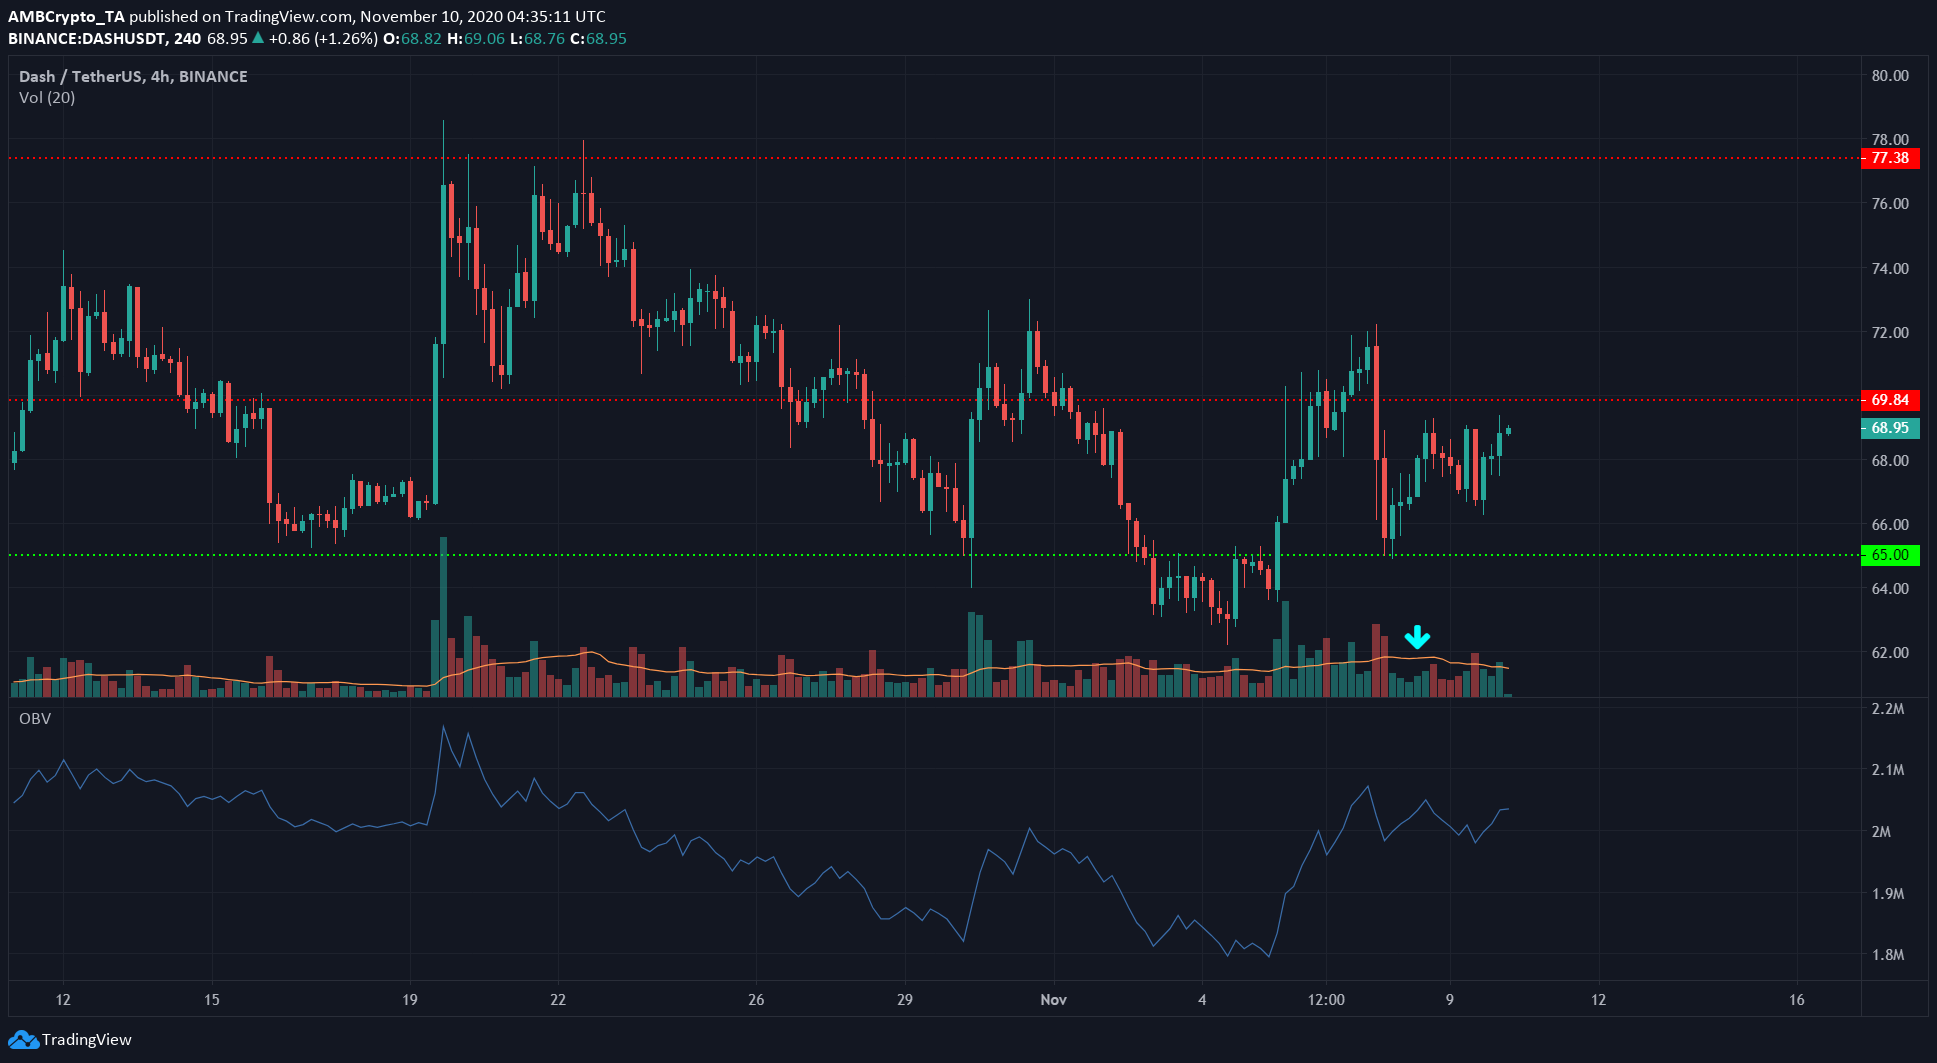
The cyan arrow showed how trading volume was low even as the price spiked. Following this disagreement between price and volume, DASH dipped from $68.8 to $66.9.
Since then, the volume has been more convincing. The OBV also showed buying volume was on the rise.
Dash has been in a downtrend since mid-October, and last week’s surge indicated it could be a reversal in trend. A successful flip os resistance at $69.8, followed by a close above $72, is needed for DASH to maintain bullish momentum.


