Ethereum
Ethereum short-term price analysis: 29 June

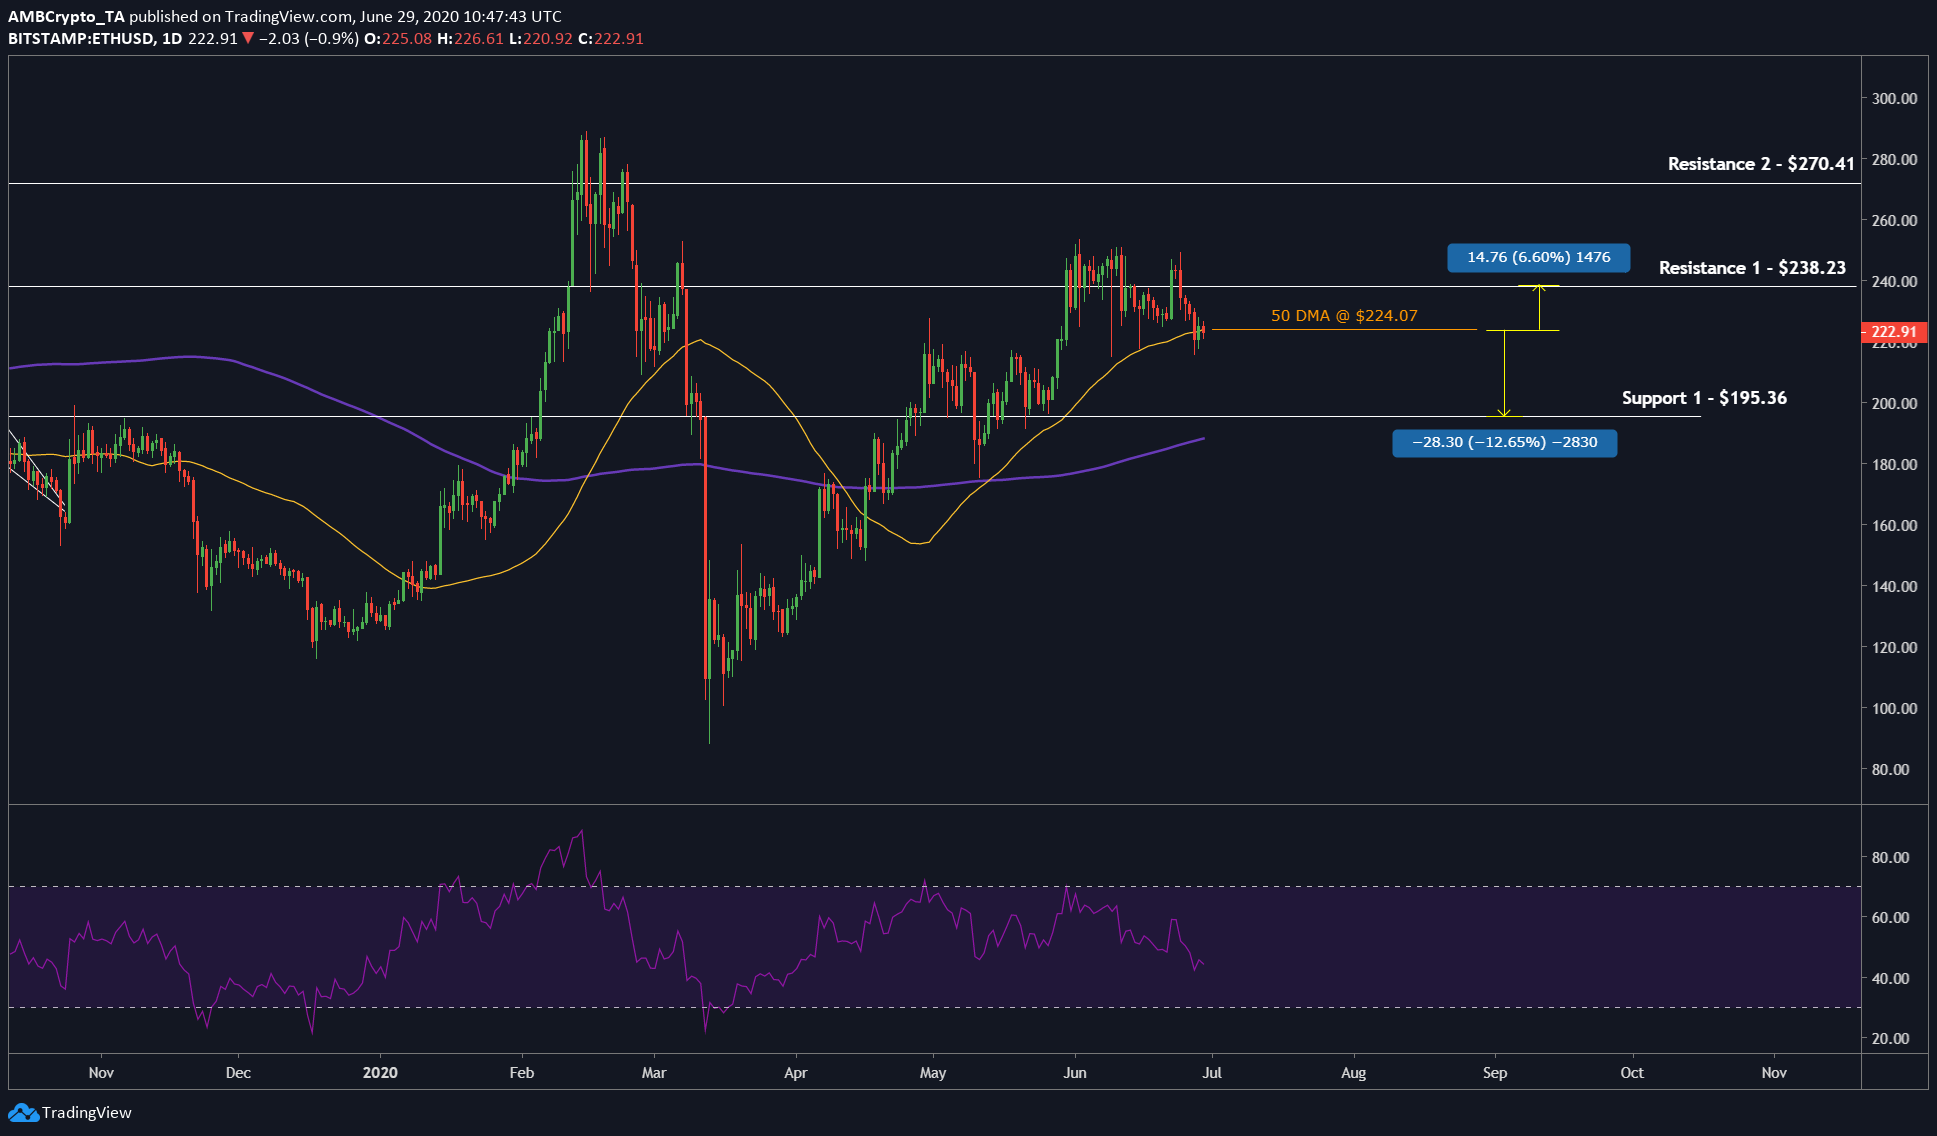
Ethereum has shed 12% in the last 3 days and it currently stands at $222.91 contending with the daily moving average. The total market cap of ETH stands tall at $24 billion and has a 24-hour volume of $6.3 billion.
Ethereum – 1 Day

Source: ETHUSD TradingView
The daily chart showed the sideways movement of ETH since May 30, which was followed by rejection at $238. While this rejection is still in play, this article takes a look at the price of ETH and its possible target for the short-term scenario.
A binary way of looking at it shows a possibility of price bouncing off the 50-DMA [yellow] and heading towards the $238-level. This would set up the price for more sideways movement. The other side of this would be for the price to breach the 50-DMA and head towards the next support level at $195. If the price surges, it would be a 6.4% surge, else, it would be a drop of 12%.
Ethereum – 1 Hour
ETHUSD TradingView
One a lower time frame of one-hour, it can be seen that the price is stuck in a consolidation pattern and is nearing the end. Since the pattern is a symmetrical triangle the breach could take place either way. Hence, looking at the RSI gives an affirmation for the direction of the breakout. With RSI and price forming higher highs, the setup looks bullish. Hence, the targets for ETH in the short-term scenario include $227.60 at a 2.22% surge from the current level and $231.08 at a 3.85% surge.
Conclusion
The short-term setup for ETH looks primarily bullish and a surge of 2% – 6% can be expected with the most optimistic target being $270. However, as mentioned above, if the price decides to breach the 50-DMA at $224 due to unforeseen circumstances, the price will head to lower levels ranging from 2.7% to 12%, with the most pessimistic target being $195.36.

