Analysis
Ethereum short-term Price Analysis: 30 October

Disclaimer: The findings of the following article attempt to analyze the emerging patterns in the Ethereum short-term market and its impact on the price.
The price of Bitcoin has been forming consecutive crests and troughs, which has been mirrored even in the altcoin market. Ethereum, the second-largest altcoin has also been witnessing its price falter, at press time, as it moves lower.
The current price has been at a crucial support juncture at $382, while the traders continued their push and pull. However, signs of the coin breaking lower this point are becoming evident in the market.
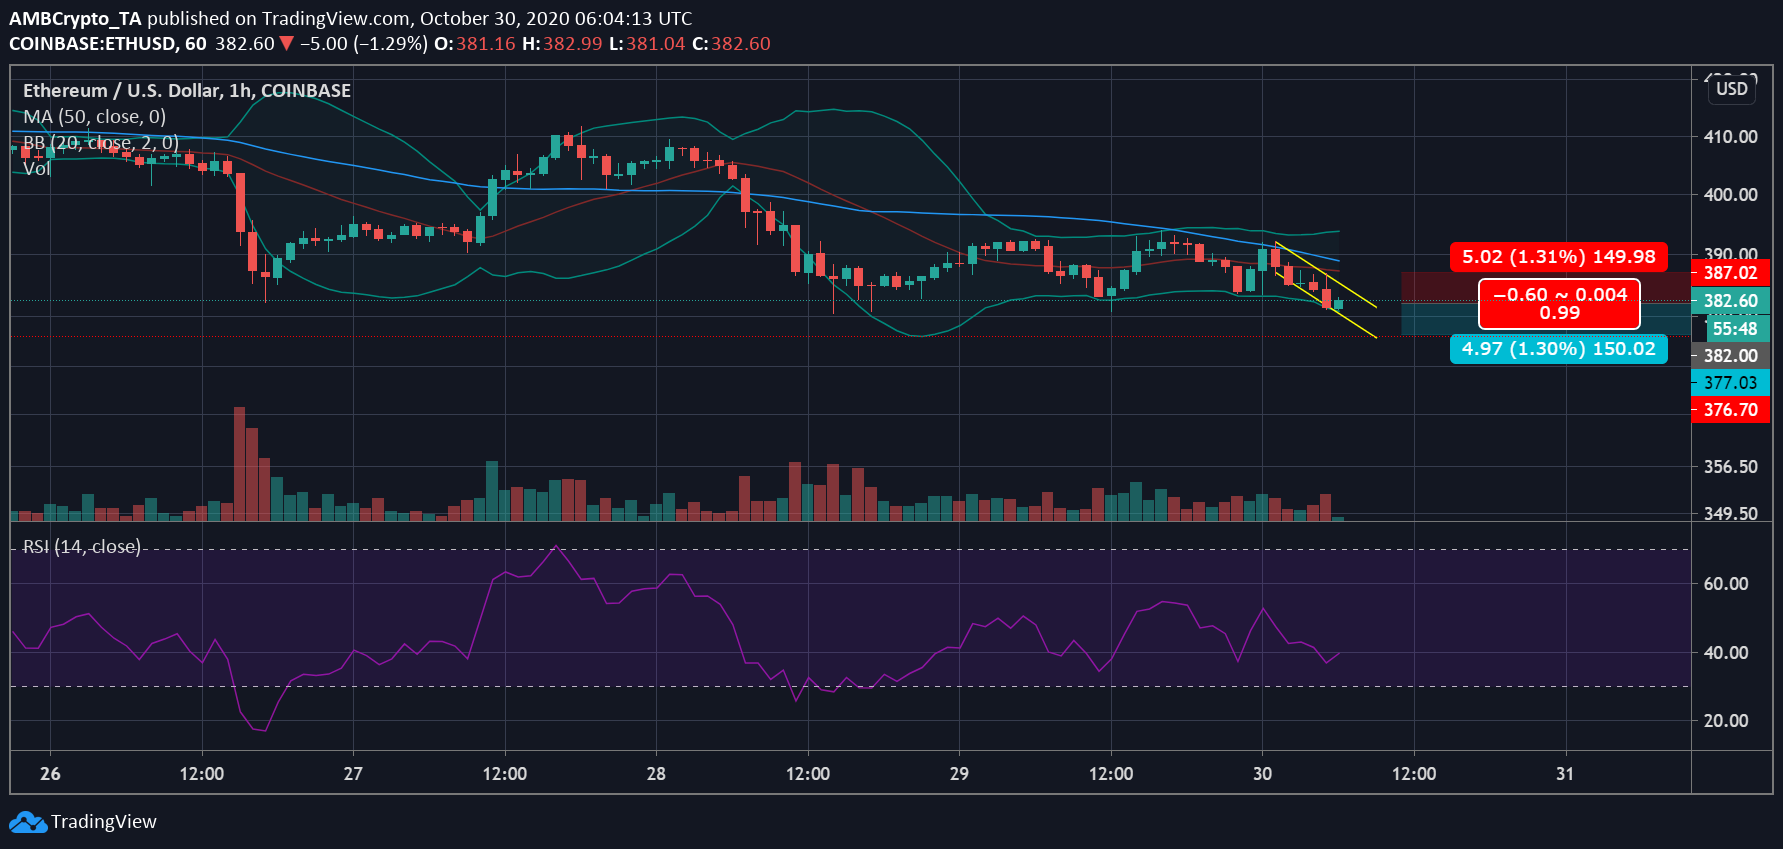
Ethereum 1-hour Chart
The above chart is highlighting the price sloping down in a descending channel. Although a break out upwards is generally expected from this trend, the ETH market has been indicating bearishness in the market.
While at the support level of $382, traders were trying to push the value of the digital asset higher, but that could only be a temporary effort as ETH is looking at a dip coming through. Which would suggest it was wise to open a short position while keeping the stop loss a little higher to count in for a little surge that we may witness before the drop.
Reasoning
The Bollinger Bands show that the volatility in the market is increasing as the bands diverge. This increase in volatility was supported by the signal line that was above the candlesticks, suggesting a downwards pressure.
Meanwhile, the Relative Strength Index has been close to the overbought zone and is trying to move away. However, given the emerging selling pressure, it may not be able to move far away but remained close to 40.
Positions
Stop-loss: $387.02
Take-profit: $377


