Ethereum short-term Price Analysis: 27 October

After reaching near the $420 range on 22nd October, Ethereum has gradually declined down to $400 over the past few days. While the minor corrections were expected, further bearish concerns were keeping the markets unsettled in the trend. However, the chances of a positive turnaround are fairly valid as Ethereum maintained a position above $400.
Ethereum 4-hour chart

Source: ETH/USD on Trading View
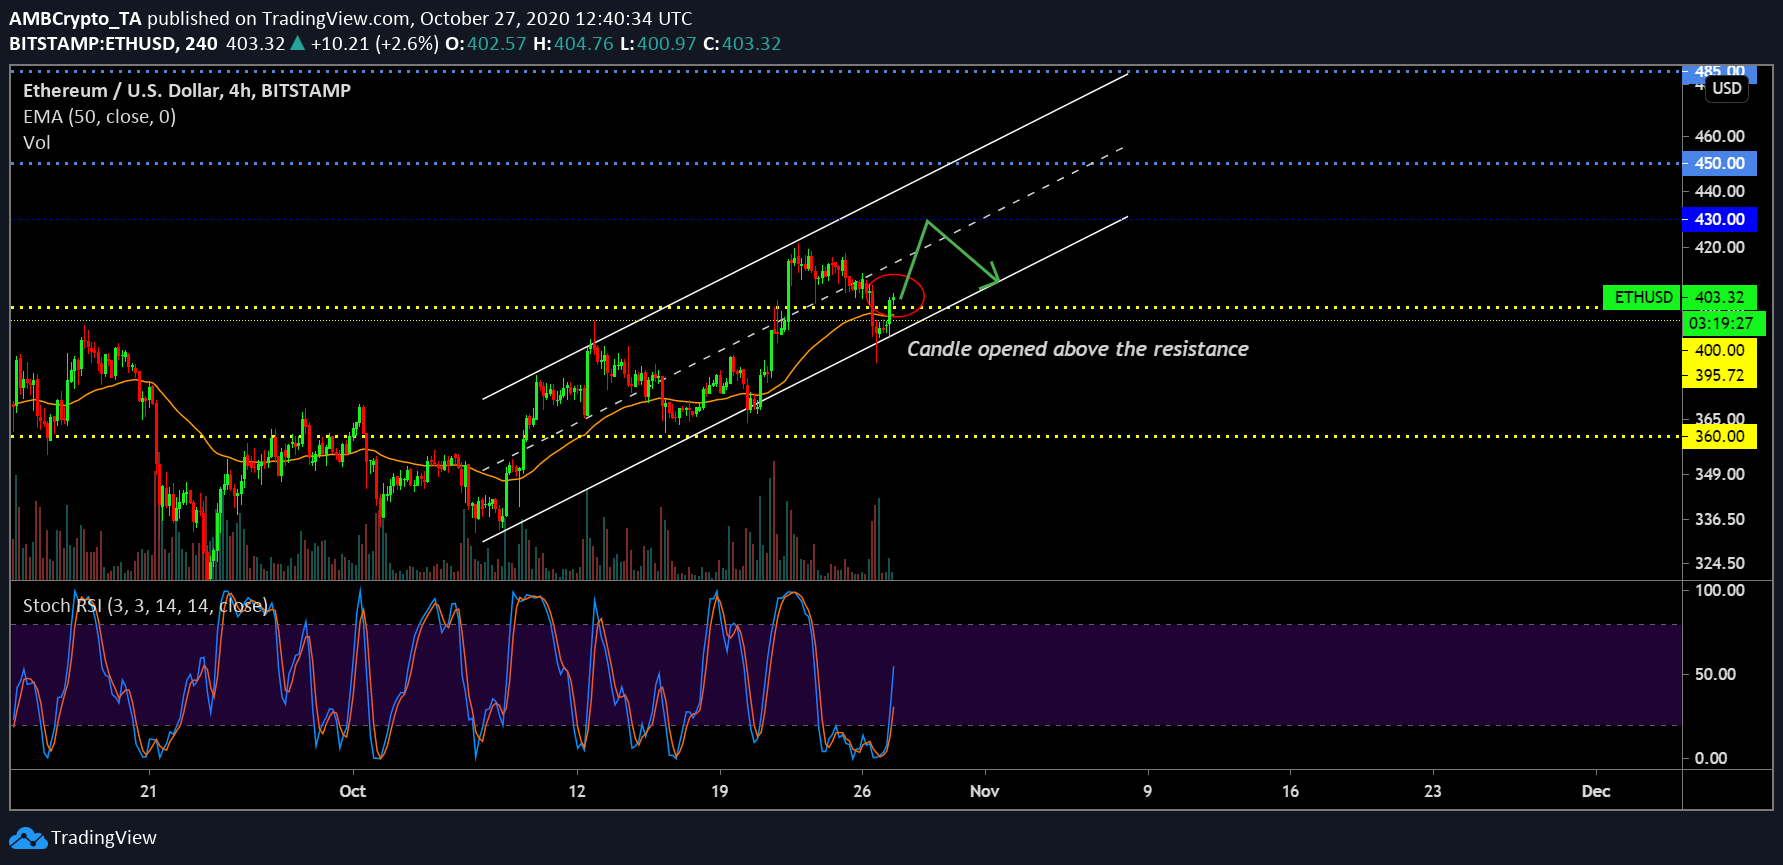
At first glance, the 4-hour chart of Ethereum would appear bearish since the asset is currently moving within the trend lines of an ascending channel. However, a bearish breakout might take place, at least not yet. Currently registering a re-test at the lower trendline, the price is moving upwards and there is a possibility the token would re-test $430 before entertaining another correction.
Minor conformation can be observed as ETH’s present 4-hour candle opened above the support of $400, which is a positive sign. The 50-Moving Average is also acting as an underlying asset at the moment, which might enforce bullish momentum for the asset.
Lastly, Stochastic RSI suggested a bullish crossover as the blue line hovered above the orange line, heading towards the overbought range.
Ethereum 1-hour chart

Source: ETH/USD on Trading View
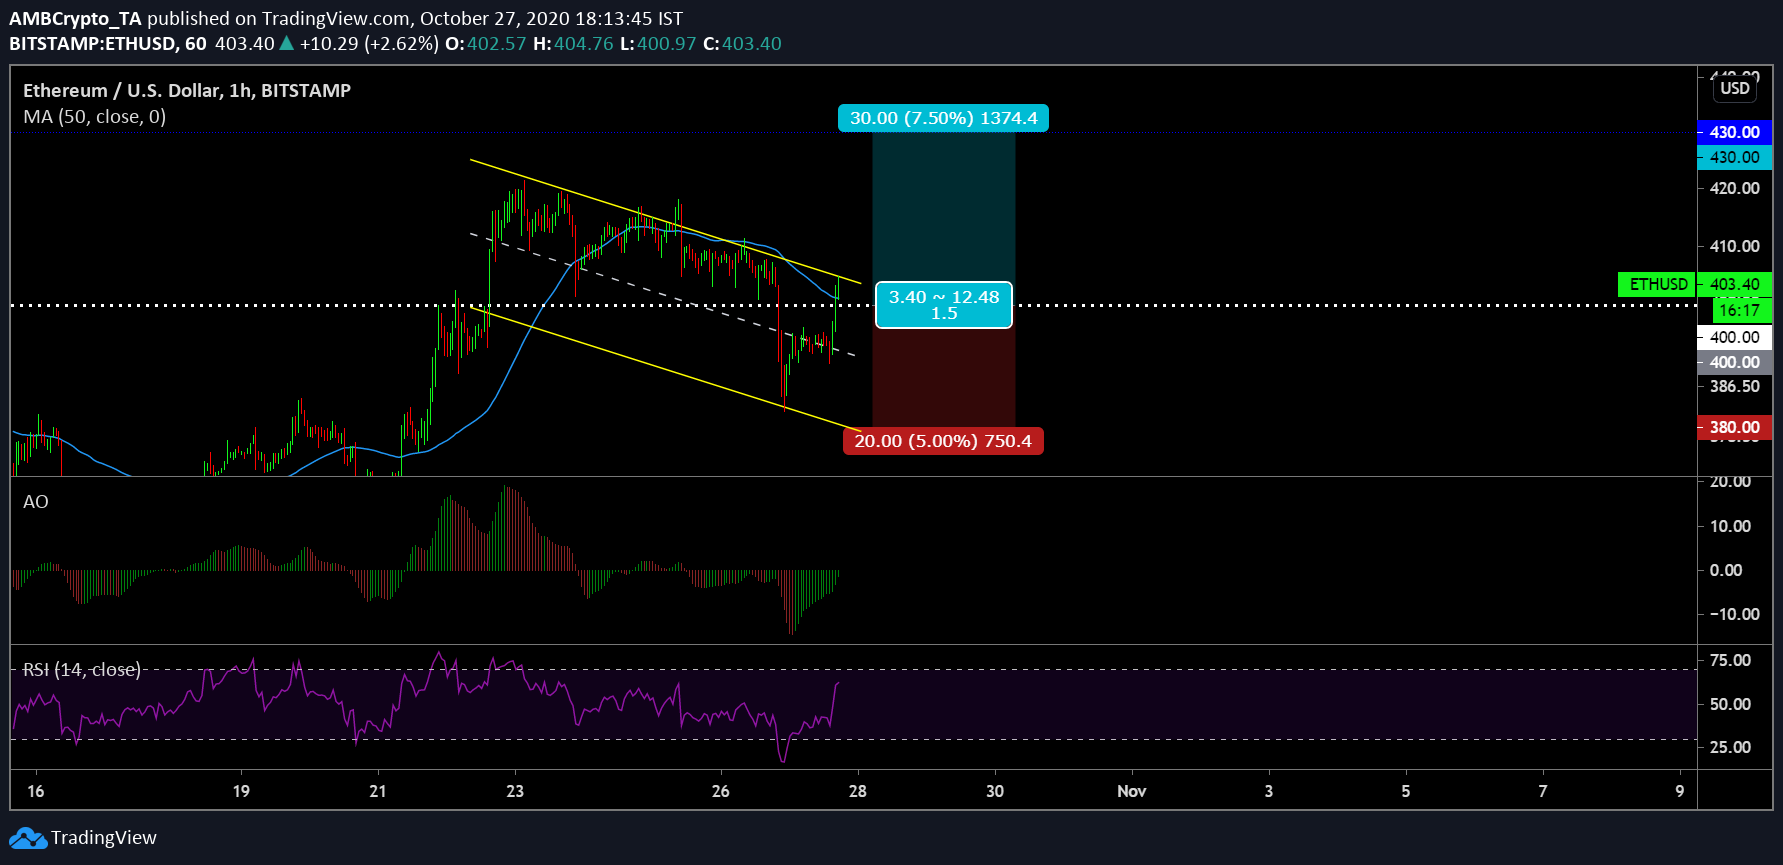
The volatility of the current trend should be kept in mind, as a fakeout candle might invalidate certain trading positions. Albeit that, a long-position can be opened keeping the entry position at $400. The stop-loss can be placed anywhere between $390-$380 as accounting for swing trading can be essential for the immediate trading period.
A take profit range should be entered at $430, completing a Risk/Reward Ratio of 1.5x.
At the moment, Awesome Oscillator remained at the cusp of turning a mild bullish momentum into a strong one, while Relative Strength Index or RSI suggested selling pressure might come into play late into the trend, which might lead to a minor drop below $400 but not $395.
50-Moving Average moved under the candlesticks, underlying the current bullish scenario for Ethereum.


