Ethereum short-term Price Analysis: 21 August

Disclaimer: The following article attempts to analyze the emerging patterns in the Ethereum short-term market and its impact on the price.
After a great boost in price, major cryptos have been observing a slow movement in the market this week. Bitcoin and Ethereum were trending lower on the price scale. Ethereum’s value despite the minimal fall has remained high at $407.55, at press time, but was witnessing strong red candles in the past few hours.

Source: ETH/USD on TradingView
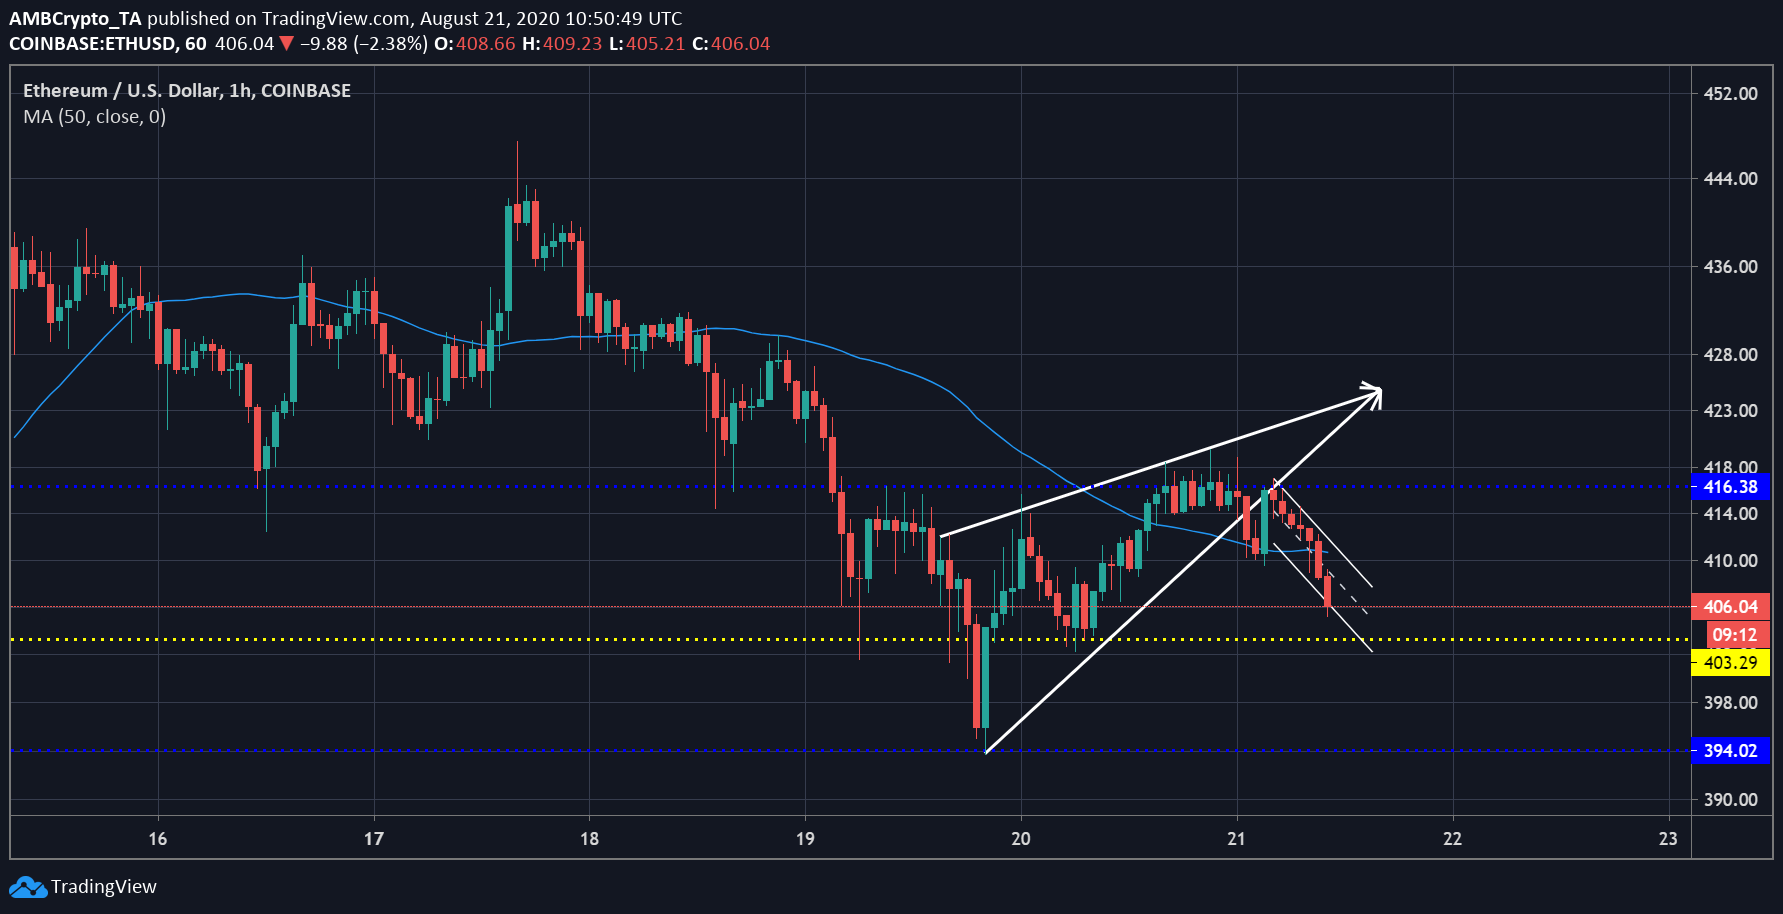
The hourly chart of the second-largest digital asset indicated that the price was breaking out in the downwards direction from a rising wedge pattern. As the price moved upwards on 19 August, a recovery effort formed pivot highs and lows converging towards a single point. As the price converged, the price broke out and was moving towards the support at $403.29. This point has previously acted as strong support and if the price reaches this point, it is bound to bounce back higher. If the price breaches this support, the next test will be at $394.
The 50 MA indicated bearishness creeping in the market as the price broke down instantaneously and the moving average slipped above the candles. Once the price manages to recover from the trenches, the resistance was strong at $416.38, which has been recently tested.

Source: ETH/USD on TradingView
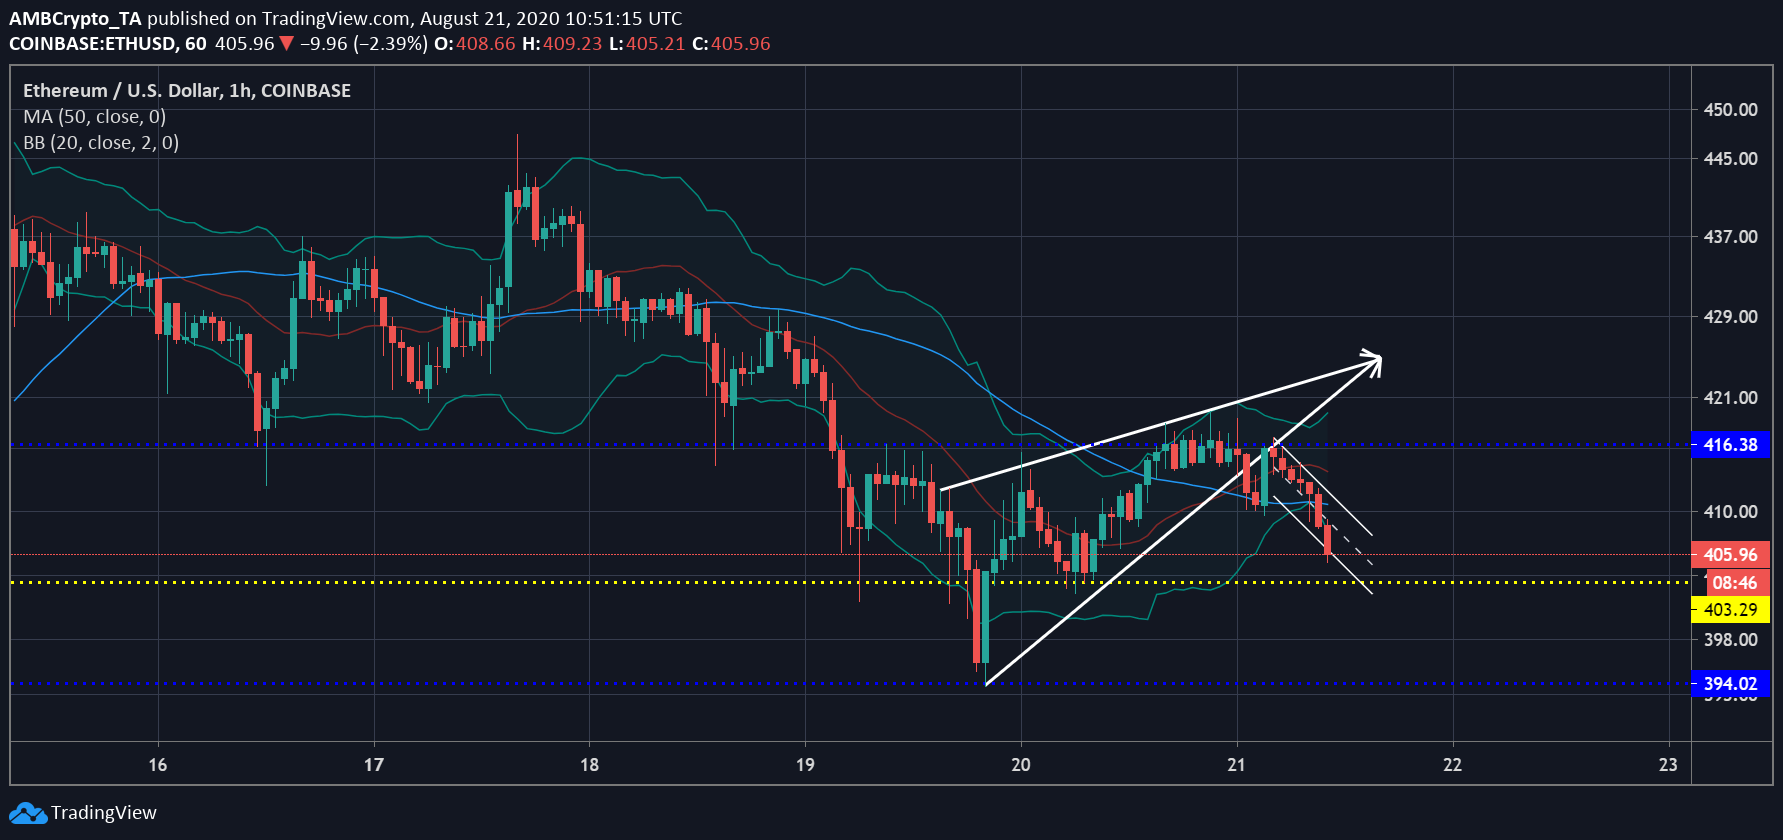
The Bollinger Bands indicator was diverging, indicating the volatility in the market was on a rise and may cause the price of the digital asset to swing. Whereas the signal line that indicated the price trend was above the candlesticks. This confirmed the price trend was moving lower and may take a little while to reverse this trend.
As the coin continued to move lower, its immediate target was $403.29, after which it may notice a reversal. However, if the selling pressure rose, the coin could test the support at $394.02.
