Ethereum short-term Price Analysis: 11 September

Disclaimer: The following article attempts to analyze the emerging patterns in the Ethereum short-term market and its impact on price.
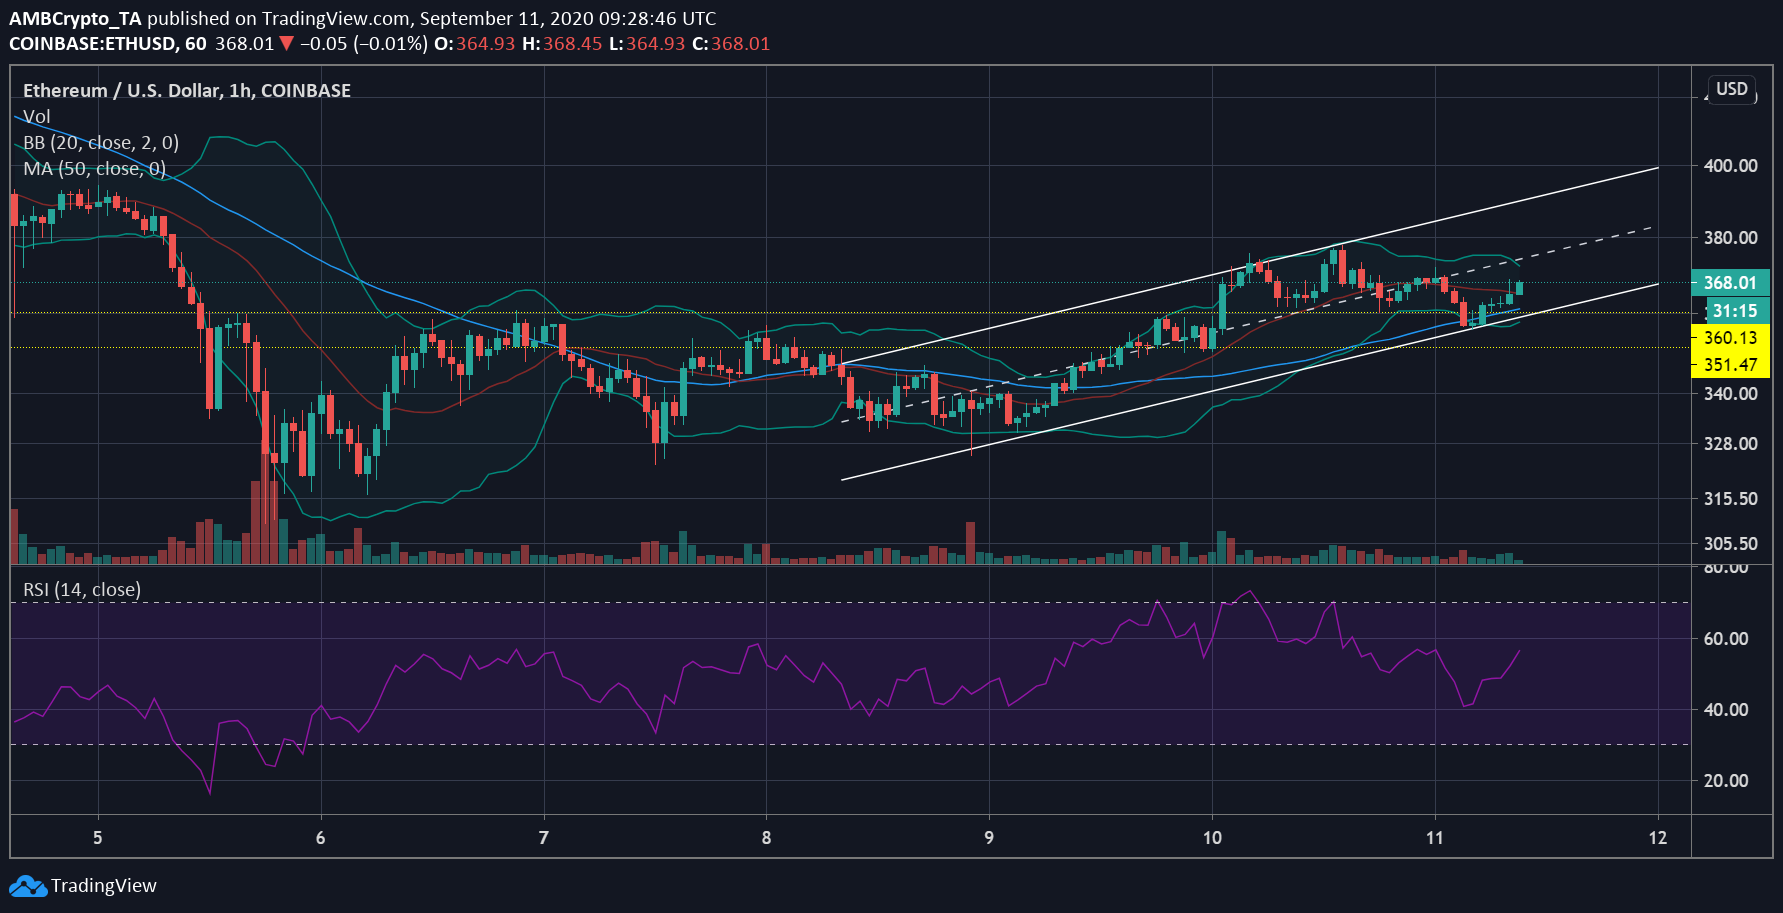
Ethereum [ETH] managed to surpass resistance at $360.13 and has been moving higher. With its current trading value around $367.48, ETH may have been approaching a trend reversal.

Source: ETH/USD on TradingView
The above hourly chart of Ethereum highlighted the upwards movement of the price after the dip in early September. This growth was, however, constrained within the parallel channels which is a bullish sign. This bullish movement of ETH price was confirmed when the 50 moving average assumed a position under the price bars as the price swung higher.
While the Bollinger Bands suggested low volatility in the market, meaning the price of ETH may not witness a tremendous change, at least in the short term. On the other hand, the Relative Strength Index has been moving away from the state of equilibrium and closer to the overbought zone. This could be a sign of accumulation in the market.

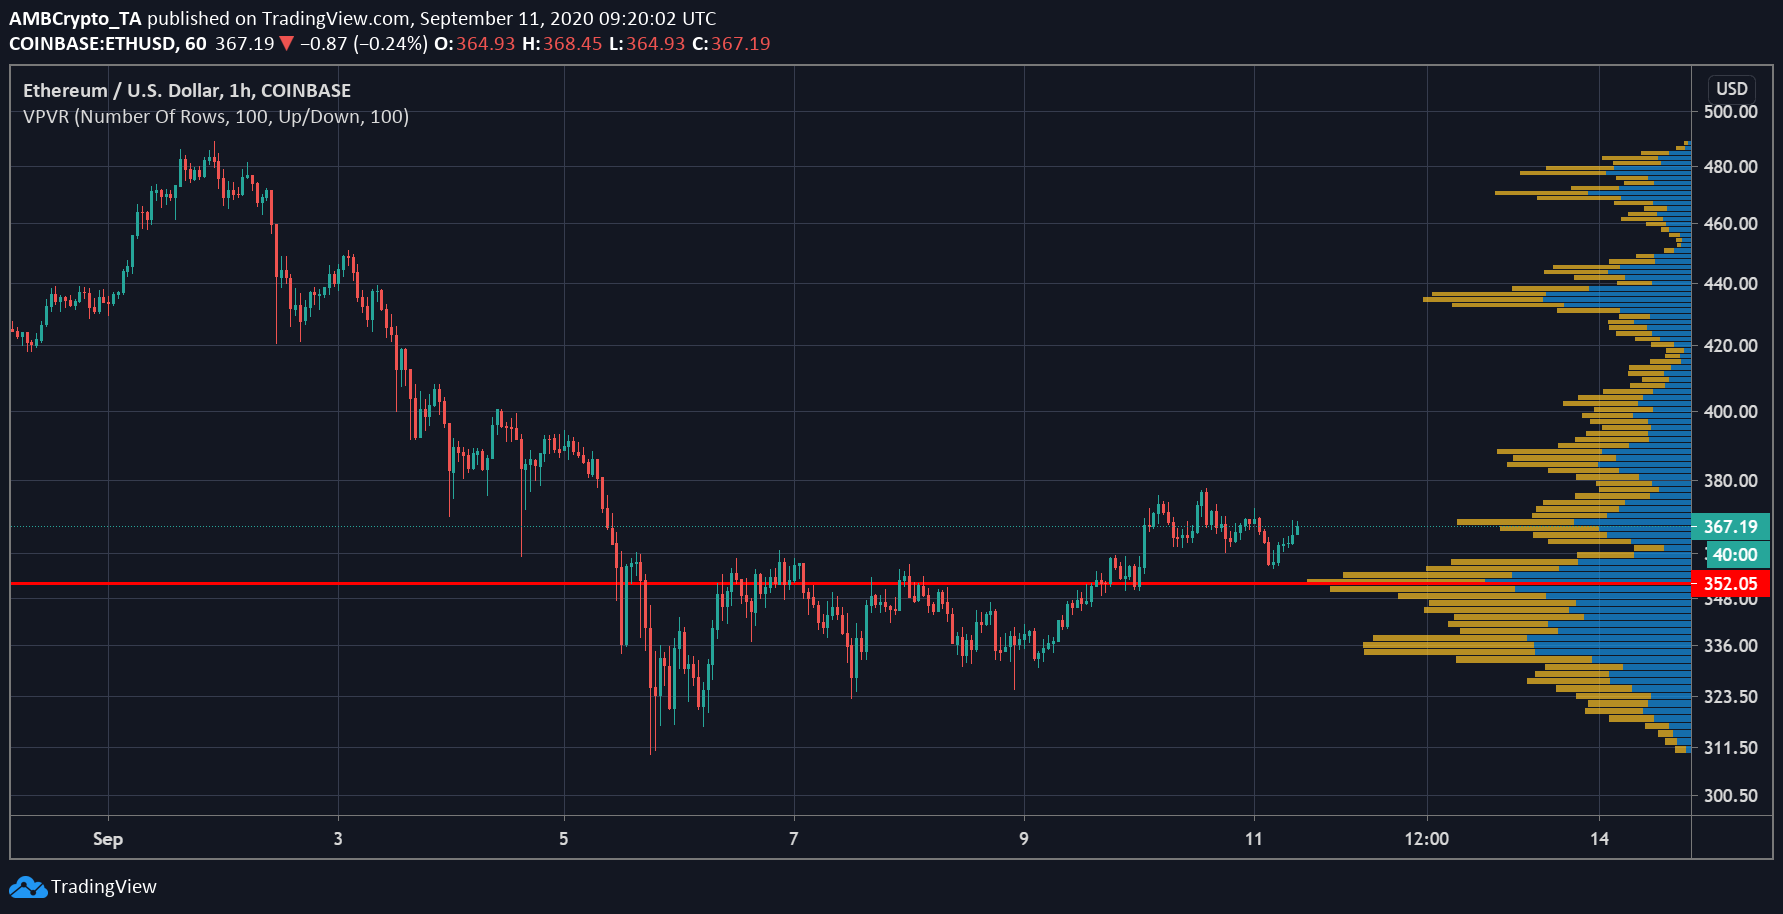
Source: ETH/USD on TradingView
As Ethereum continued its upwards journey, the channel line was marking resistance close to $390. Meanwhile, the Visible range noted that $434 was a support point for the price of Ethereum, but as the price dipped below this point, it temporarily found support at $352. This has been a point of control for Ethereum’s price in the given period, but the immense pressure pushed the price lower till $310. $352 turned into resistance for the digital asset and was able to breach past it after three tests.
At press time, ETH has been at a higher volume node which meant more traders were participating at this price point. Even if the price collapses at this level, the PoC could act as strong support as it did on 10 September.


