
Ethereum’s price was on a steady run-up for a while but has faced roadblocks in recent times. One such roadblock is the EIP-2025 for the Istanbul update. The controversy surrounding this proposal has caused the price of Ethereum to dip.
The price of Ethereum at press time was $213 with a market cap of $22 billion, which is 8 times lower than that of Bitcoin. The price shows a negative change in the last hour and in the longer 7-day timeframe.
1 Hour
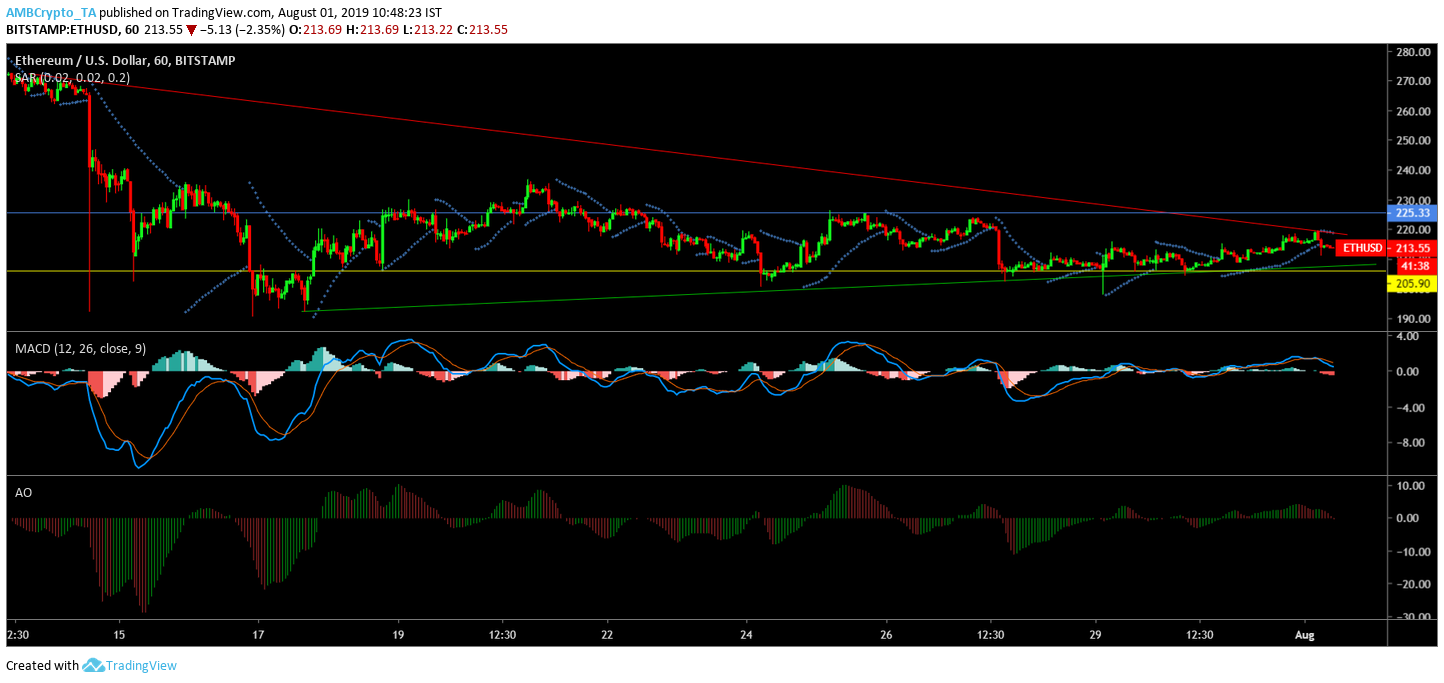
Source: TradingView
The one-hour chart for Ethereum showed a downtrend that extended from $272 to $218, and an uptrend that ranged from $192 to $208. The support for Ethereum in the one-hour chart was seen at $205. The price is stuck between the previously-mentioned support and the resistance at $225.
Parabolic SAR showed a bearish momentum for Ethereum in the one-hour chart as the AO dots were seen above the candles.
MACD indicator showed a bearish crossover indicating an imminent decline for the prices in the near future. The bearish crossover was taking place above the zero-line.
Awesome Oscillator showed red lines being formed above the zero-line indicating that the short-term momentum was holding up. There was also a formation of bearish twin peak indicating a bearish pressure for Ethereum.
1 Day
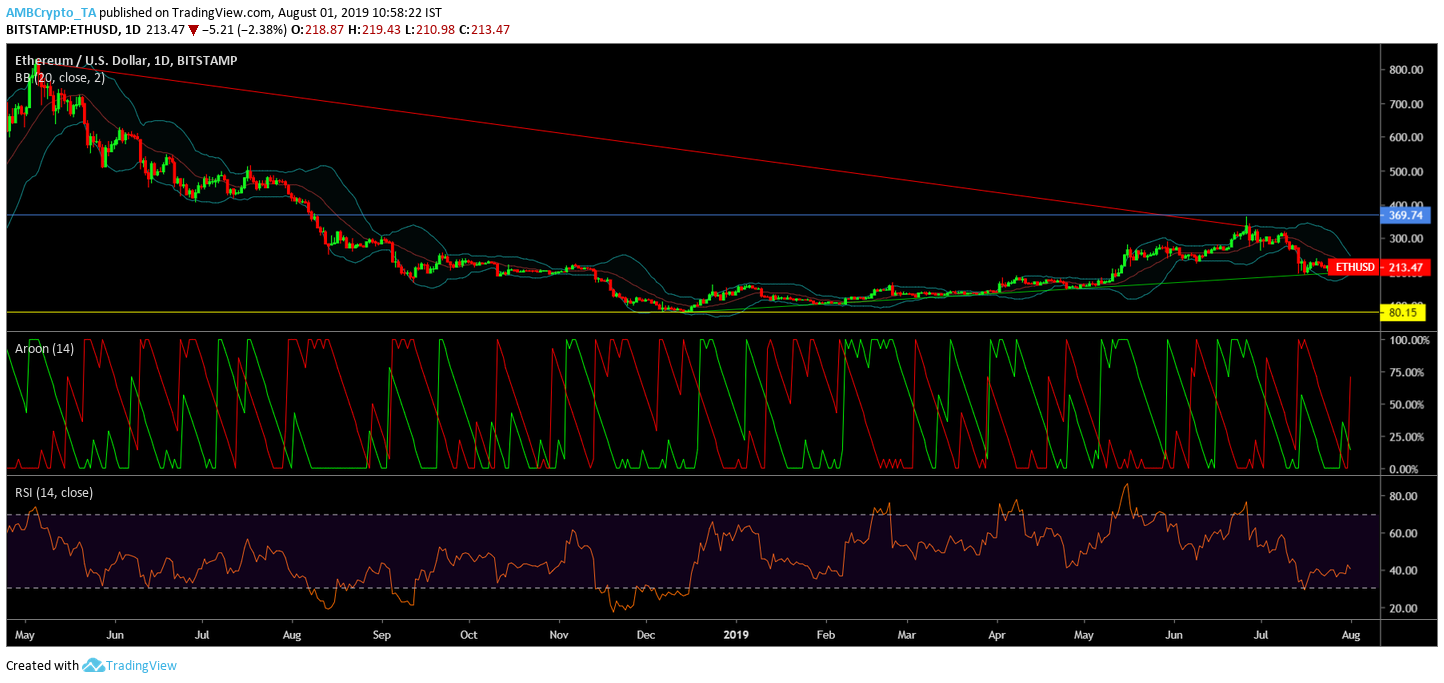
Source: TradingView
The one-day chart showed a bearish downtrend that extended from $823 to $334 whereas the uptrend extended from $78 to $199. The immediate resistance for Ethereum was seen at $369; the support for Ethereum was formed in December 2018 at $80.
Bollinger Bands are being squeezed indicating a reduction in volatility. The price was below the simple moving average, indicating a bearish pressure.
Aroon indicator showed the Aroon uptrend rising above the 50-line and heading towards the 100-line.
Relative Strength Index was at the 40-line, indicating a lower buying momentum. The RSI was just above the oversold zone.
Conclusion
The one-hour and the one-day chart both indicate a bearish outlook for Ethereum as indicated by the above-mentioned indicators.