Ethereum long-term price analysis: 4 August

For Bitcoin, its current price position is not typically on unfamiliar grounds. However, the narrative was completely different for Ethereum. The largest altcoin is currently trading at a range last witnessed during mid-2018. So it is fair to say for Ethereum, there is a little more to lose. With the trend outrightly bullish over the past couple of weeks, has the largest altcoin reached the end of this ride? Maybe not.
Ethereum 1-day chart

ETH/USD on Trading View
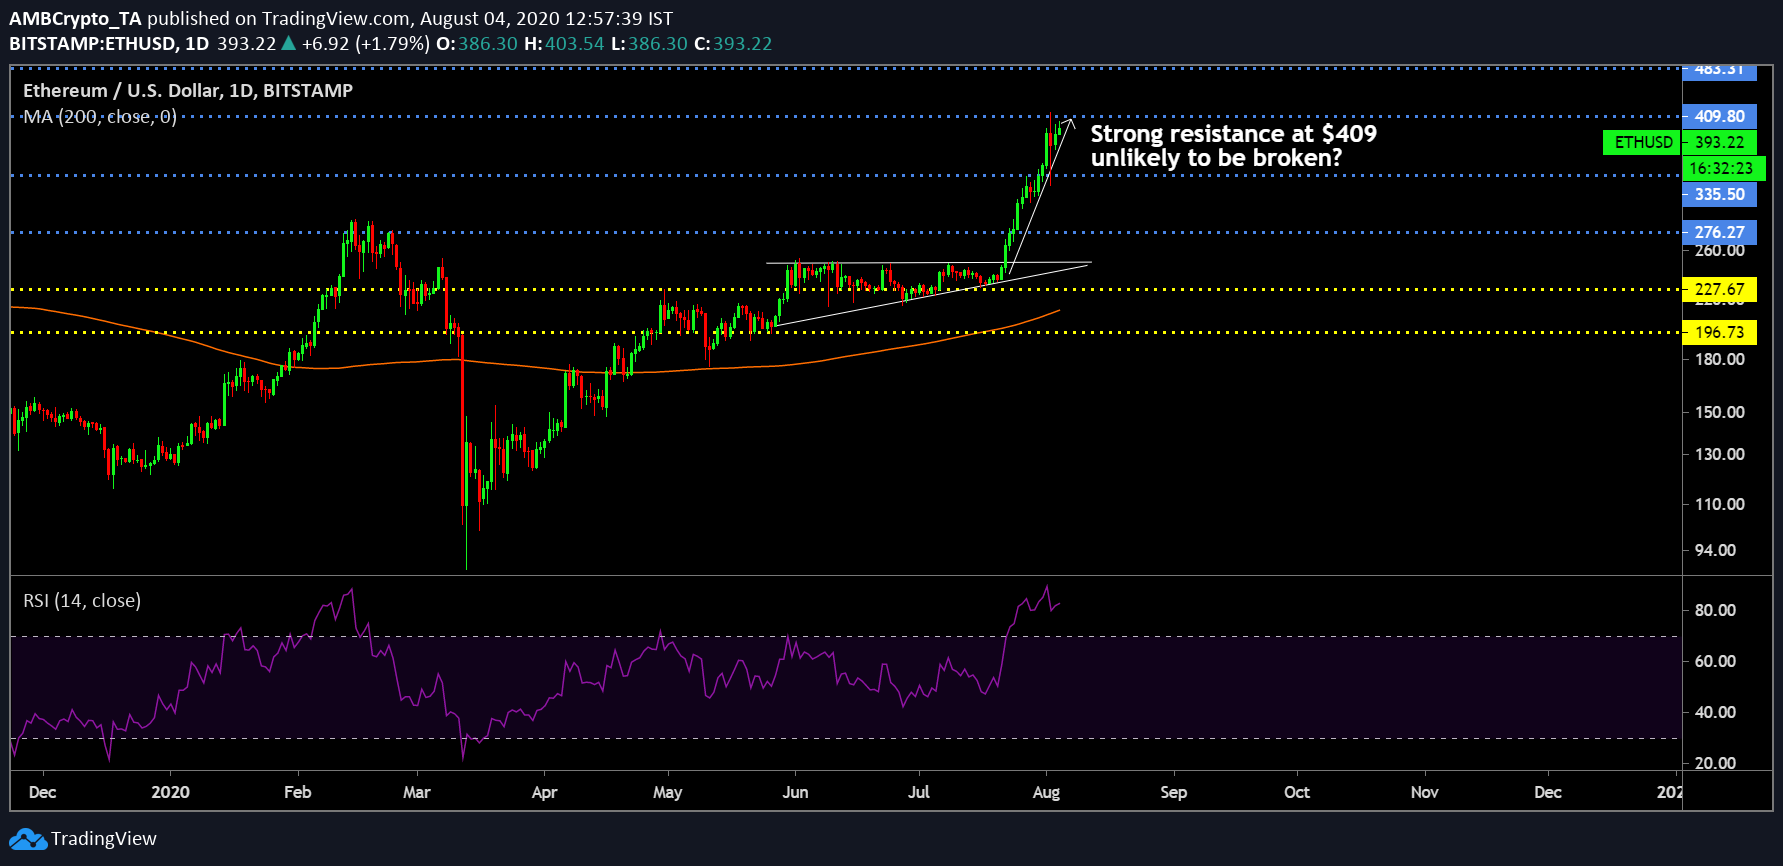
On analyzing Ethereum’s 1-day chart, we can see that from the 1st week of June to 3rd week of July, the asset oscillated within the pattern of an ascending triangle that underwent a bullish breakout on 22nd July. The breakout has been vertical in the charts, bursting past key resistance at $276, $335, and recently $365-$370.
The drop witnessed by the collective market on 1st August did make some ETH traders uneasy because for a brief period, its value dropped down to $325 from $407. However, in the past 36 hours, the asset has been consolidating above $370 range.
From a technical perspective, the rally will end sooner rather than later, and there are signs that the current rally has already ended.
Ethereum is currently struggling with resistance placed at $409, which is obvious considering it was last breached in 2018. So trading at this range is a little unfamiliar for ETH.
Relative Strength Index can maintain a high buying pressure for only so long. Sellers are definitely going to come back if the price continues to consolidate under $409.

ETH/USD on Trading View
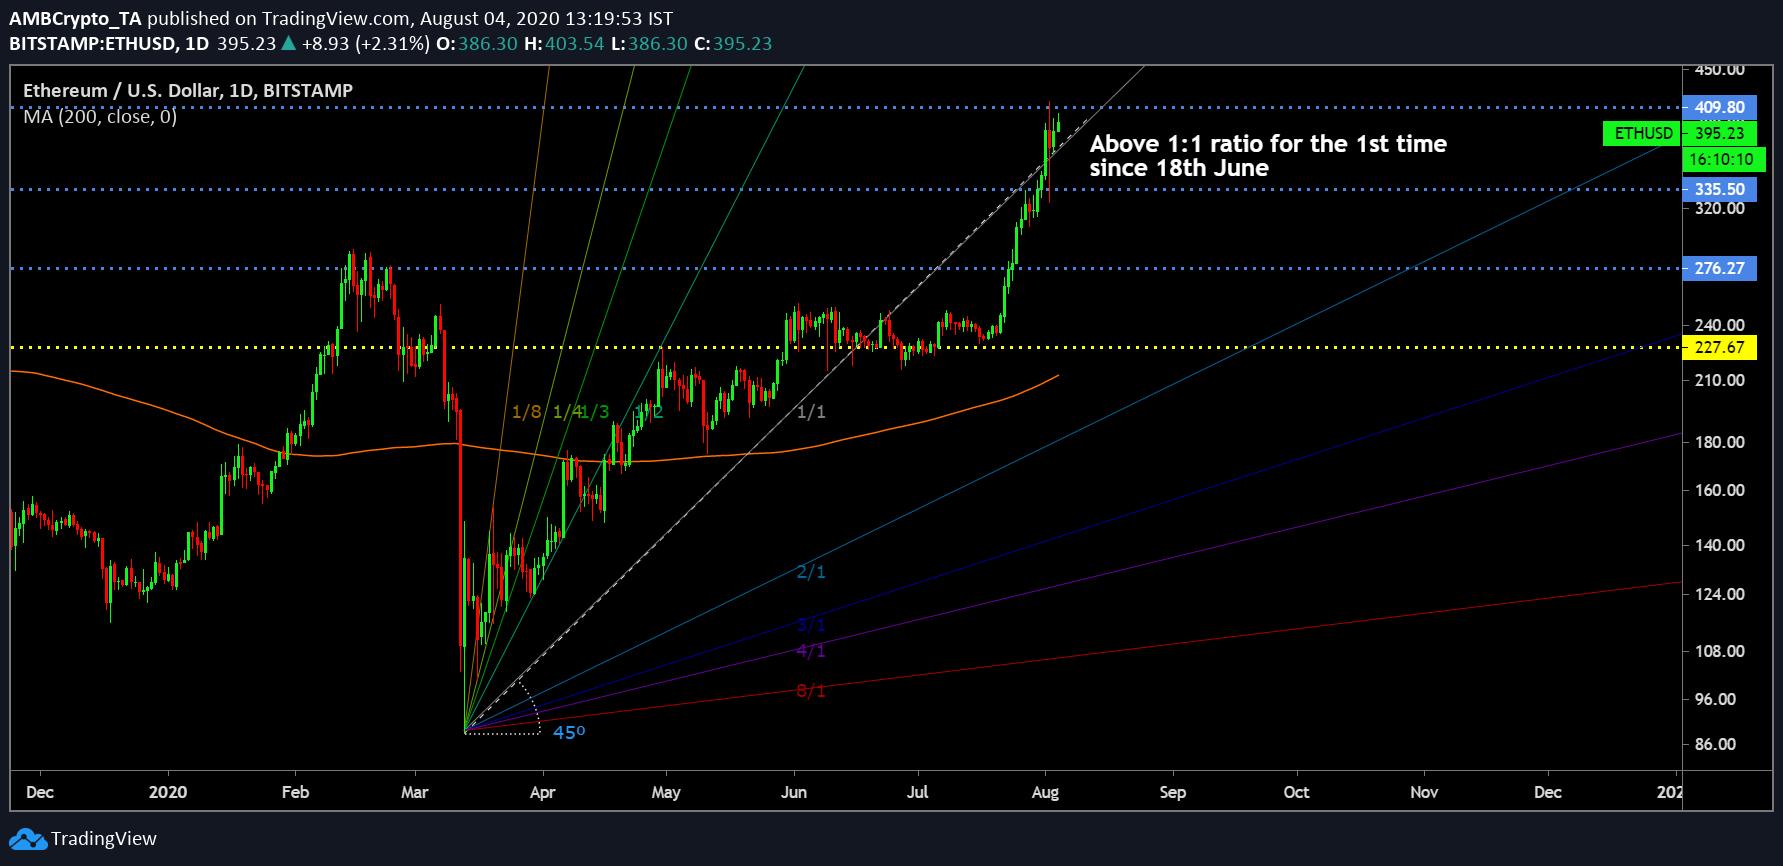
Now, Gan Fann indicator suggested that Ethereum crossed over the 1:1 ration line in the above chart, which is significantly bullish from a long-term point of view. After depleting under the ratio line on 10th June, the market sentiment is predominantly bullish again, hence some new investors could be tempted into this price range.
Although such a scenario might push the price up a bit again, it is important to note that sustaining consistent trading volume between the range of $335 and $409 will benefit Ethereum in the long-term.
Conclusion
Ethereum will possibly conduct sideways movement over the next week before another significant trend kicks in.


