
Disclaimer: The following article attempts to analyze the emerging patterns in the long-term Ethereum market and its impact on the price
Etheruem has gotten off its rallying horse, with the cryptocurrency noting a significant dip in value over the past week. There have also been issues related to the gas price due to congestion on the Ethereum network. However, Tether [USDT] has taken the first step towards integrating with the OMG network, in order to ease gas prices. However, despite such prevalent scalability problems, the impact on Ether’s price has been fairly minimal.
At the time of writing, Ethereum had tested its immediate support at $380.24, before bouncing back to hold steady at a value of $387.

Source: ETH/USD on TradingView
As per the attached chart, the world’s largest altcoin’s price has been gradually dropping, along with the descending channel pattern. Further, the 50 moving average was pointing to the formation of bearish pressure in the ETH market as it slid above the price bars. The Visible Range has been helpful in identifying the dominant and significant price levels based on volume.
In the given period, the Point of Control for Ethereum was at $395.02, while its press time value was under this level. On the contrary, price points $391 and $397 have been highly traded levels, marking immediate support and resistance for the price of the digital asset. The value of ETH was oscillating at this level, having tested the PoC twice.
Source: ETH/USD on TradingView
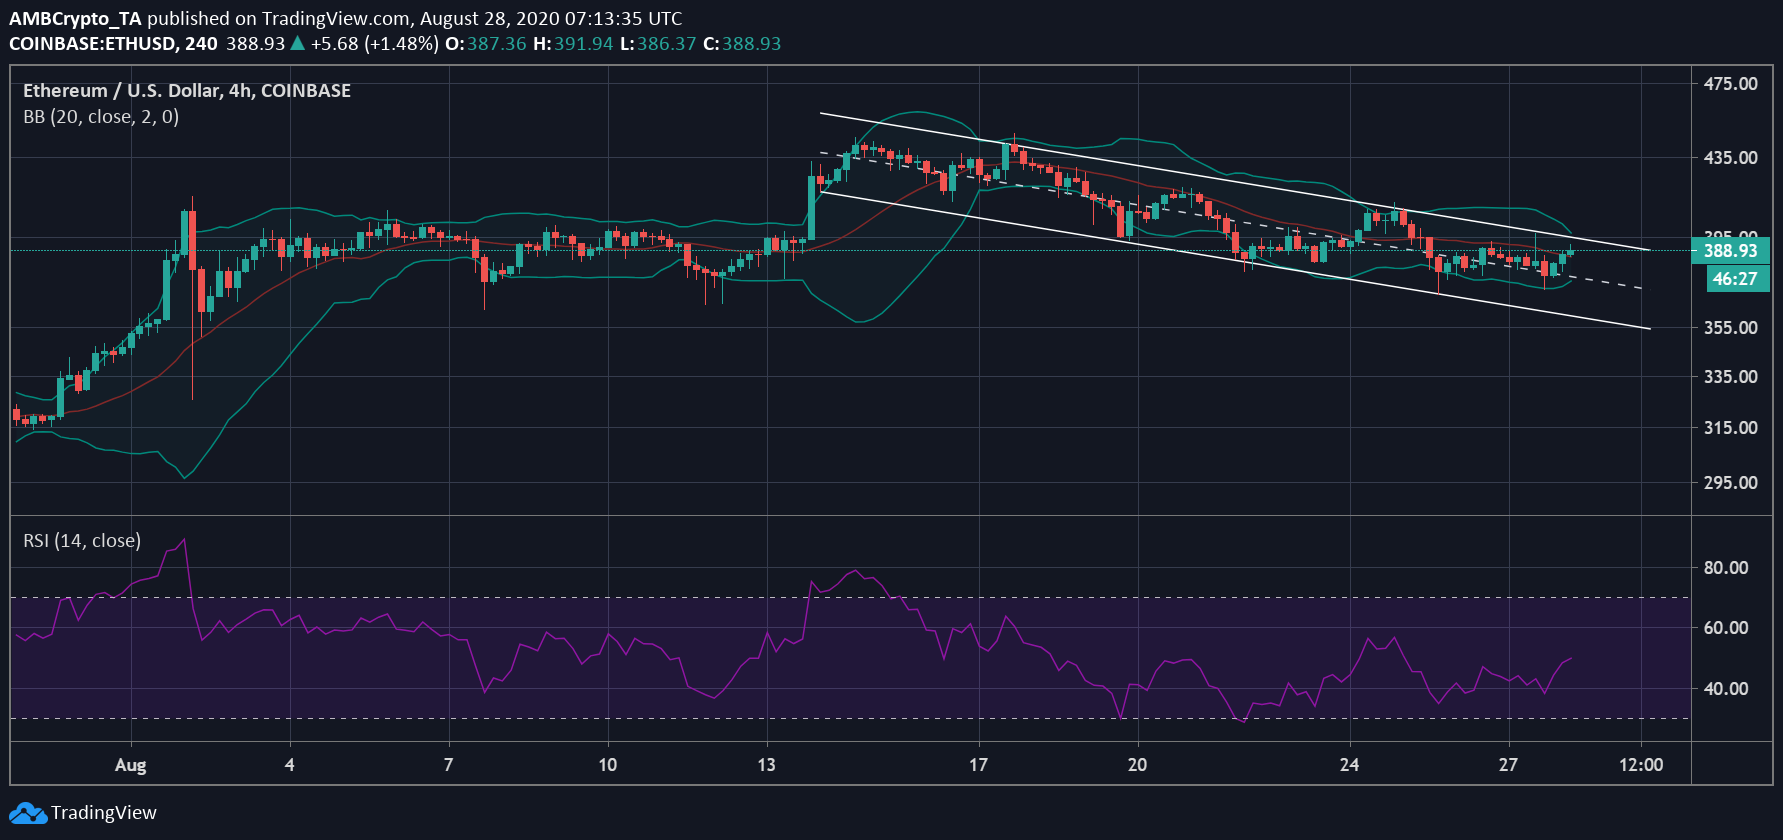
The Bollinger Bands have also been pointing towards a trend reversal for Ethereum. The Bands had converged, indicating that the market was experiencing low volatility. Further, the Signal line confirmed the trend reversal as it moved under the candlesticks. This might suggest that the price may breach $395, and will have to deal with the resistance marked at $399.
Finally, the Relative Strength Index bounced back from the oversold territory and was spiking higher on the charts. This showed the growth of buying pressure in the market, despite the fact that the buyers and sellers were evening each other out, at press time.