Ethereum long-term Price Analysis: 24 July

Disclaimer: The article attempts to analyze the evolving pattern in the Ethereum’s long-term market and predict the price trend.
The second-largest cryptocurrency, Ethereum [ETH] has been preparing for the launch of Ethereum 2.0, meanwhile, the growth of the DeFi platform has been creating a lot of interest in the ecosystem. Given the building momentum, the news of US banks offering crypto custody caused the sentiment to move in the ETH market as the asset has been noting almost a 20% spike in the past two days.
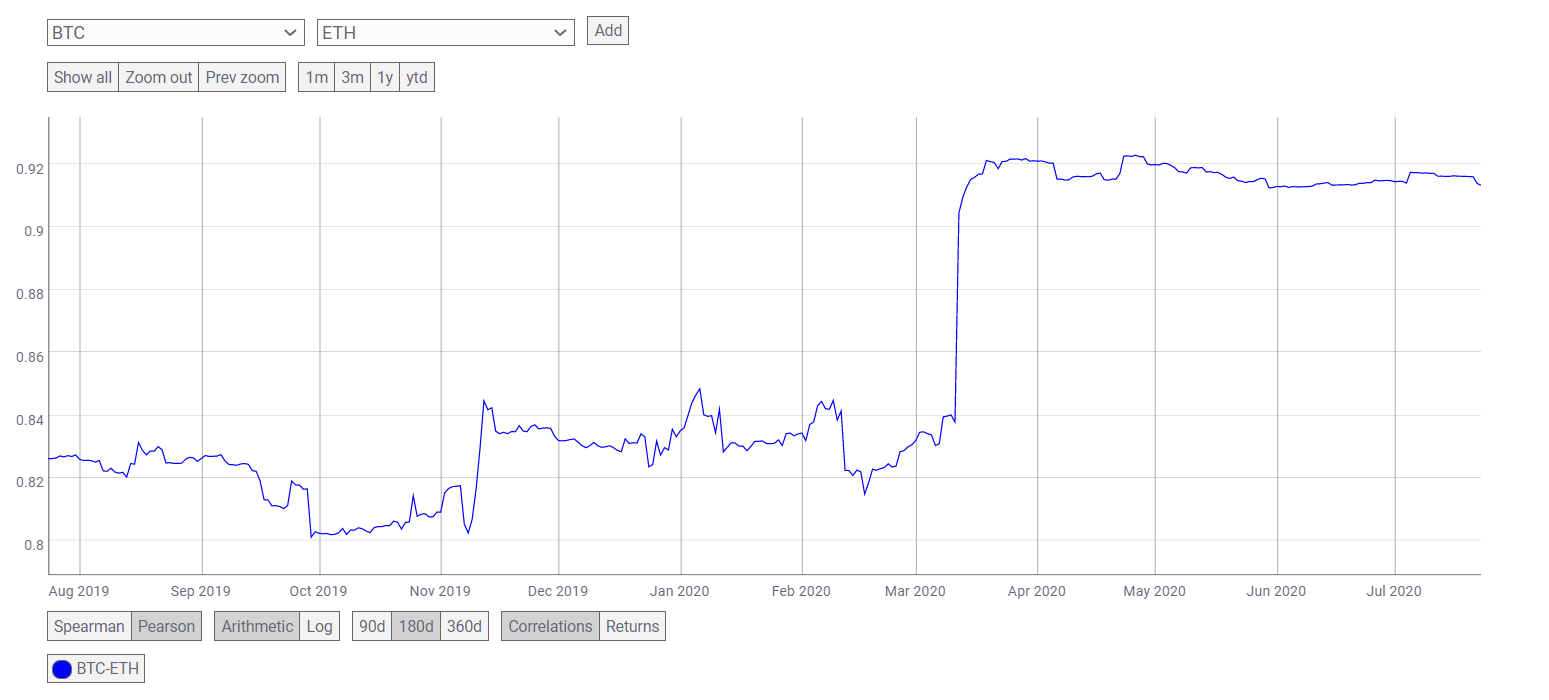
At press time, ETH was trading at $270.75, while its correlation with the largest asset, Bitcoin has dipped since its peak in April at 0.9226. Currently, the Pearson correlation coefficient for ETH-BTC stood at 0.9133.

Source: CoinMetrics
Even though the altcoin had not become independent and was still very much linked to Bitcoin, it has been forming a bullish pattern, that has resulted in the consecutive three-day growth.

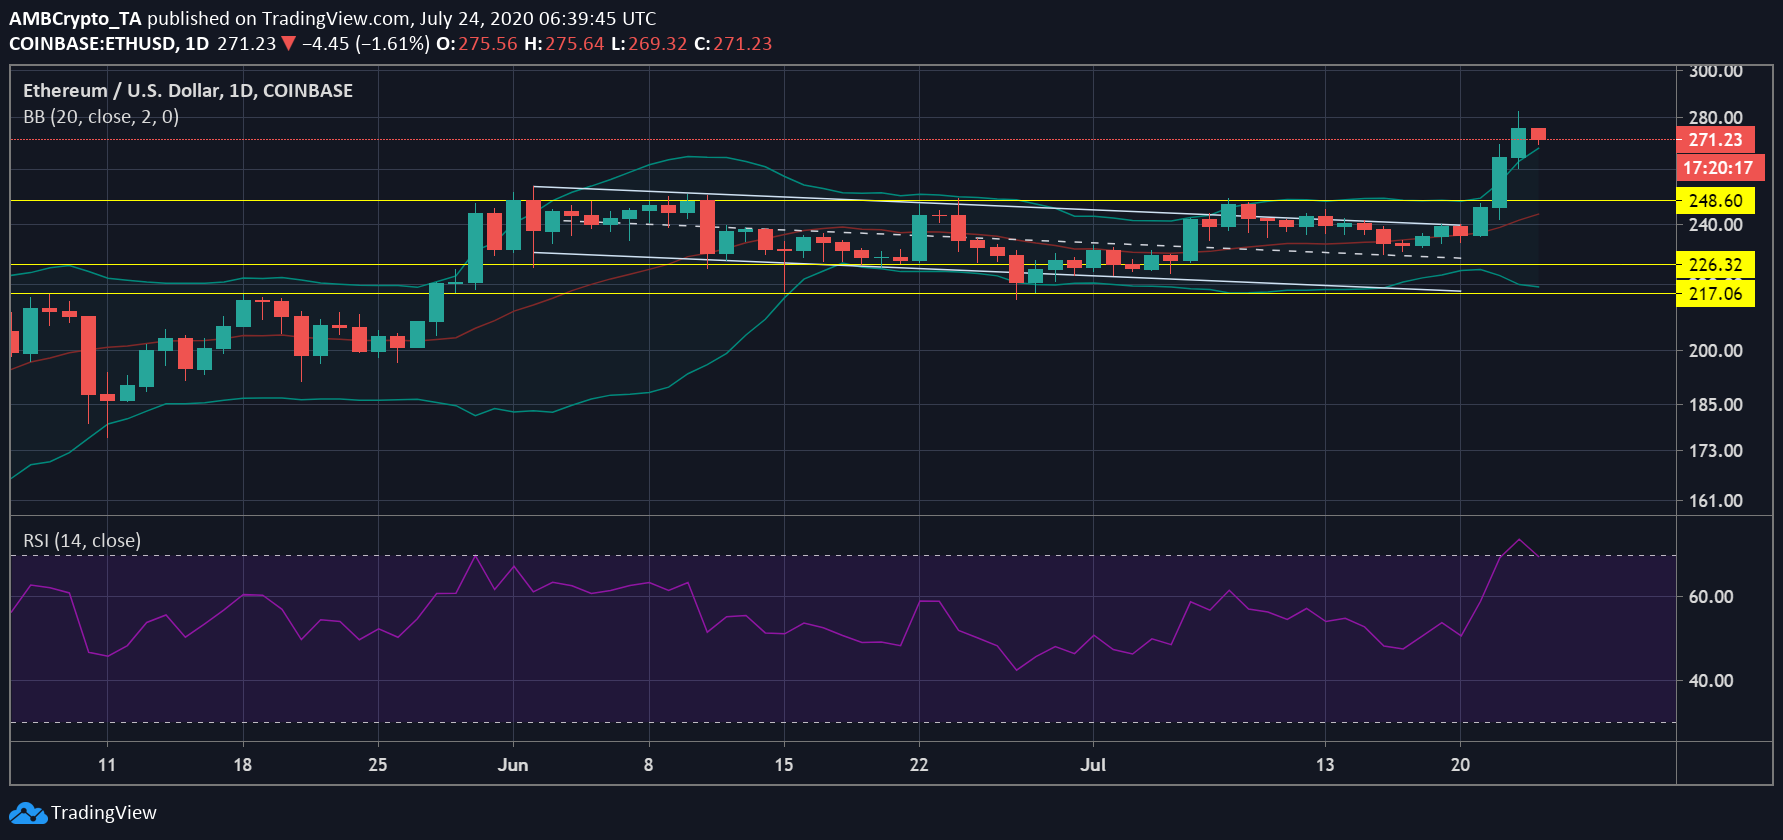
Source: ETH/USD on TradingView
According to the daily chart of ETH, it had been trending lower each day, reporting lower highs and lower lows. However, the trend was not as steep as before and there was a gradual loss in value. As the descending channel connected the lower highs and lower lows, it was appearing as a continuation pattern, given the previous break was upwards. Thus, another upward push to the ETH value was expected and on 21 July ETH broke out of the descending channel and pumped from $235.77 to $282.60.
The ETH market may witness some correction due to this sudden boost in price. The coin lacked strong support and if the value collapsed further, it may move lower to $248.60, after which the support was at $226.32. That would erase the profits earned by investors during the current pump, however, that’s when active trading will play a vital role. The Relative Strength Index Value was peaked at 73 on 23 July and at press time, was dipping back under 70. This high value suggested that the asset was overbought and may have to attain equilibrium as it dipped further.


