
Ethereum, though the market’s second-largest cryptocurrency by market cap, has traditionally been loyal to Bitcoin’s price movement. Where Bitcoin goes, Ethereum follows. The same was noted to be happening, at press time, with Ethereum about to break out of the bearish pattern following Bitcoin’s cues.
Trading at $369, at the time of writing, we might see Ethereum head back to $340 and perhaps lower on the charts, should Bitcoin sellers not show any sympathy.
Ethereum 4-hour chart
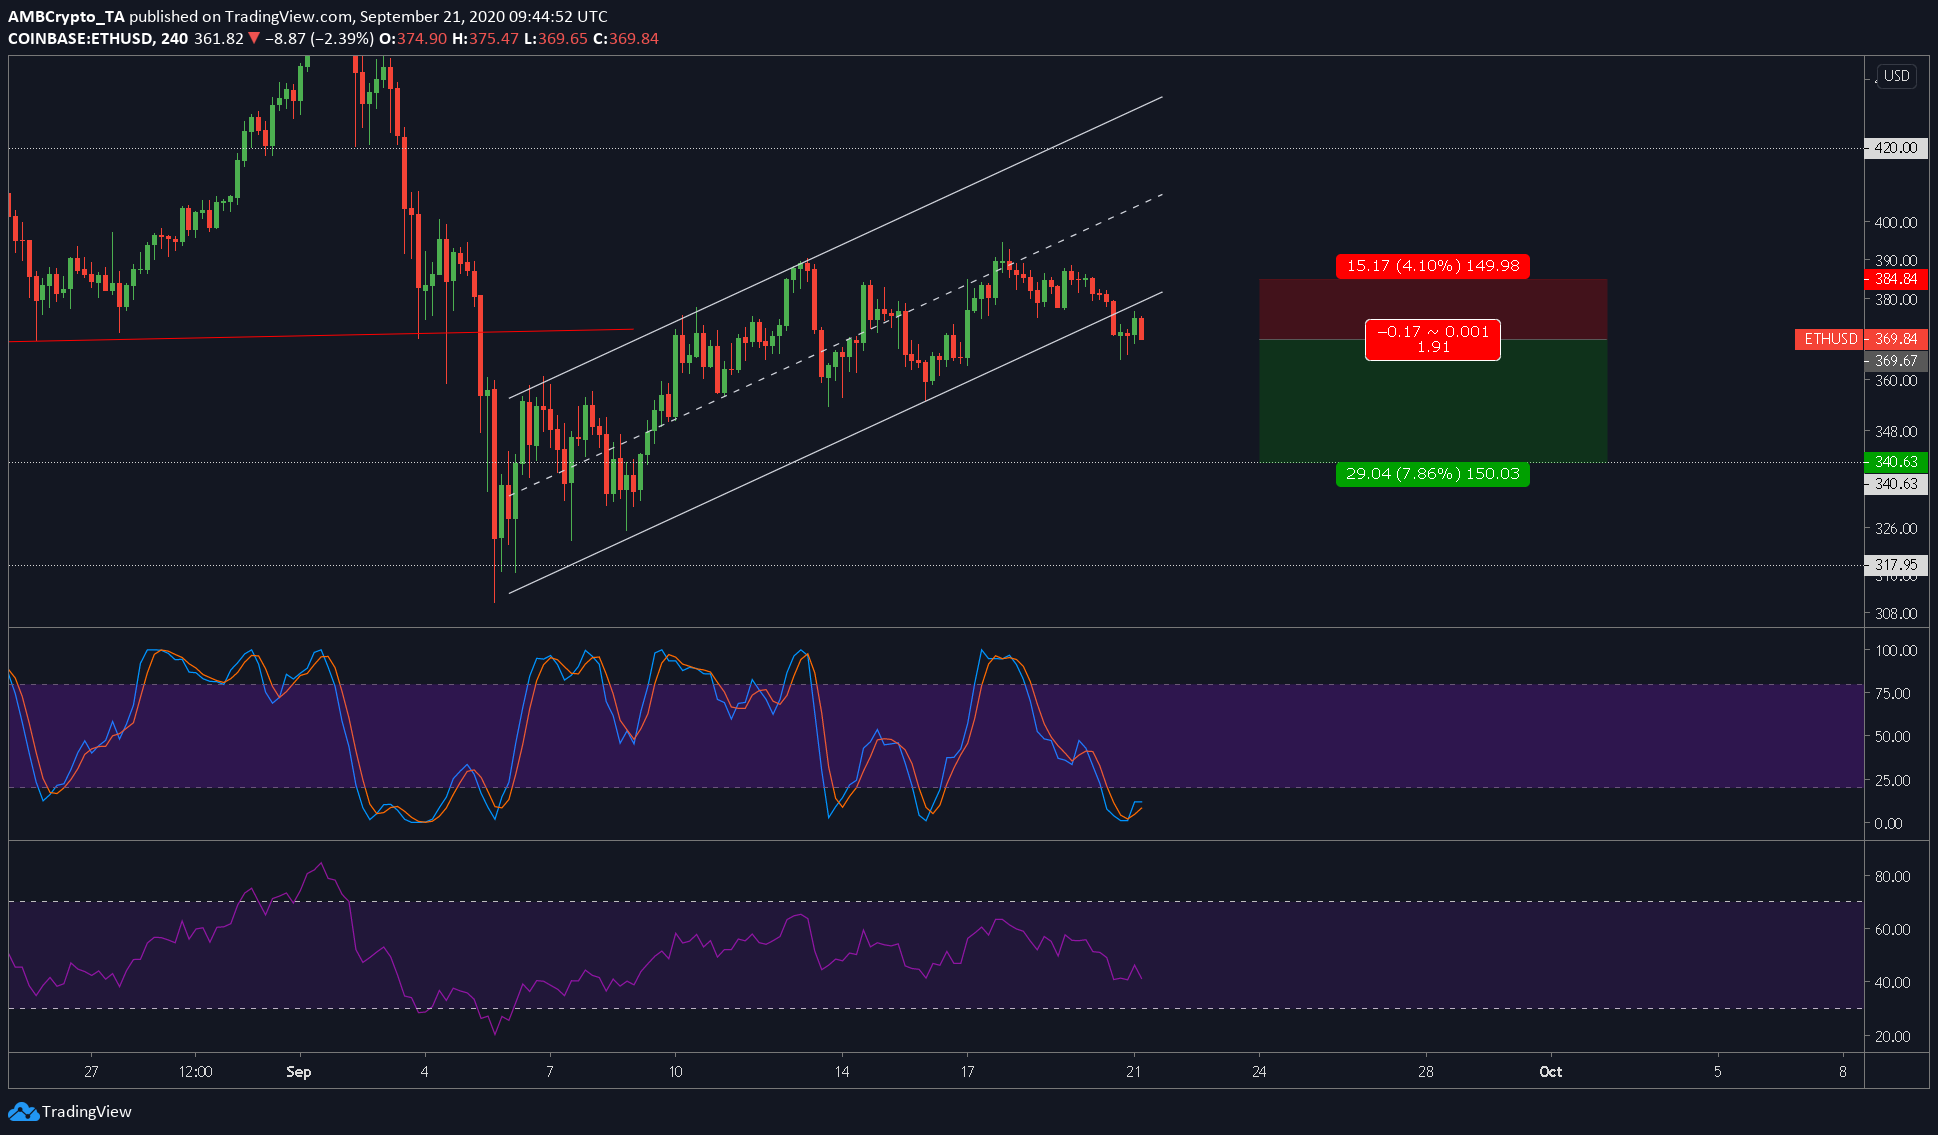
Source: ETHUSD on TradingView
The attached 4-hour chart showed that ETH was already breaching out of its ascending parallel channel. Moreover, the trend prior to the channel made this a continuation pattern – a bear flag.
A short position at $369 with a stop-loss at 4% [aka $384] would be the best entry [if one hasn’t already shorted before the breach]. The targets for ETH could be the immediate support at $340, which would mean a 7.86% drop. This trade would yield an R of 1.91.
The Stochastic RSI was already in the oversold zone and might undergo another bearish crossover supporting the price’s drop. The RSI indicator, however, had a long way to go before it hit the oversold zone. Hence, we can expect the price to easily hit the first target at $340. However, the second target at $318 would be a bit of a stretch, although theoretically, that would be the perfect target.
Although this trade was in the short-to-medium term, the long-term chart has been foreshadowing this drop for a while now, at least after the price dropped below $377.
Ethereum 1-day chart
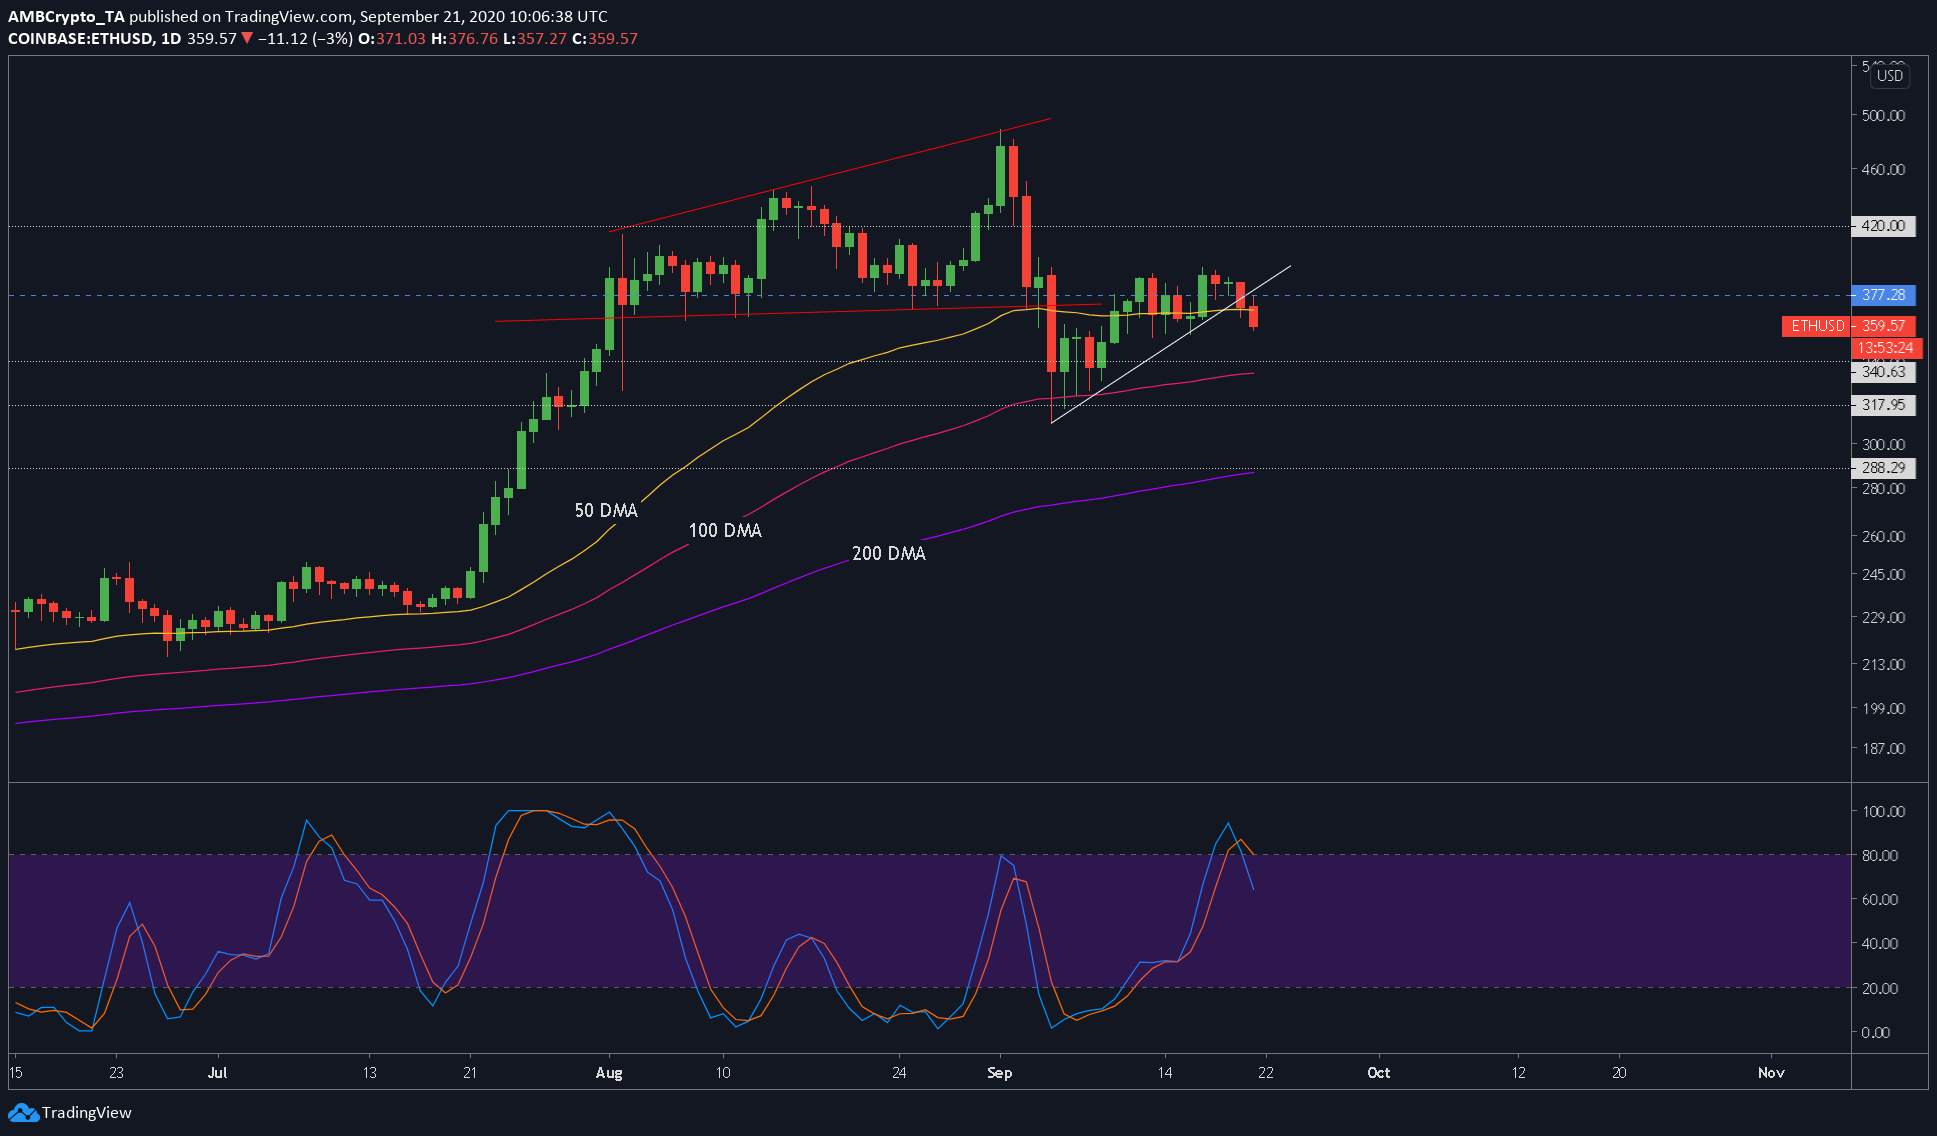
Source: ETHUSD on TradingView
The one-day chart for ETH showed a trendline extending from the low of 05 September, all the way up to 19 September. After this point, the price closed below this trendline, a development that confirmed a downtrend.
Further doubts of a downtrend can be strengthened since the price dipped under the 50-DMA [yellow]. The target, according to the moving averages, seemed to be the 100-DMA [Pink] at $333, slightly lower than the first target mentioned above.
The one-day chart showed the Stochastic RSI hitting a bearish crossover just above the overbought zone. Hence, the downtrend for ETH was really bad, especially since BTC’s charts presented a similar bearish crossover on the daily time frame.