
Taking a leaf from the Bitcoin playbook, Ethereum, the largest altcoin in the market has been playing stable. Since the end of May, the latter has been trading sideways, going through Q2 2020 riding a massive bullish wave after a disastrous end to Q1.
On March 12, as Bitcoin dropped by over 50 percent, Ethereum fell to double-digits, for the first time since December 2018. However, a strong collective crypto-market resurgence saw Ethereum rise above the market. Between March and July, the price of ETH gained over 150 percent, rising from below $100 to over $254.
This strong recovery saw Ether trade in a robust upward channel for over three months. In early May, as Bitcoin rose above $8,000 prior to the halving, Ether was trading sideways between $200 – $220, hitting the lower end of the channel and rising above only on 28 May. This rise saw the altcoin push from $205 to $250 in less than a week, breaking the resistance at $217.5 in the process.
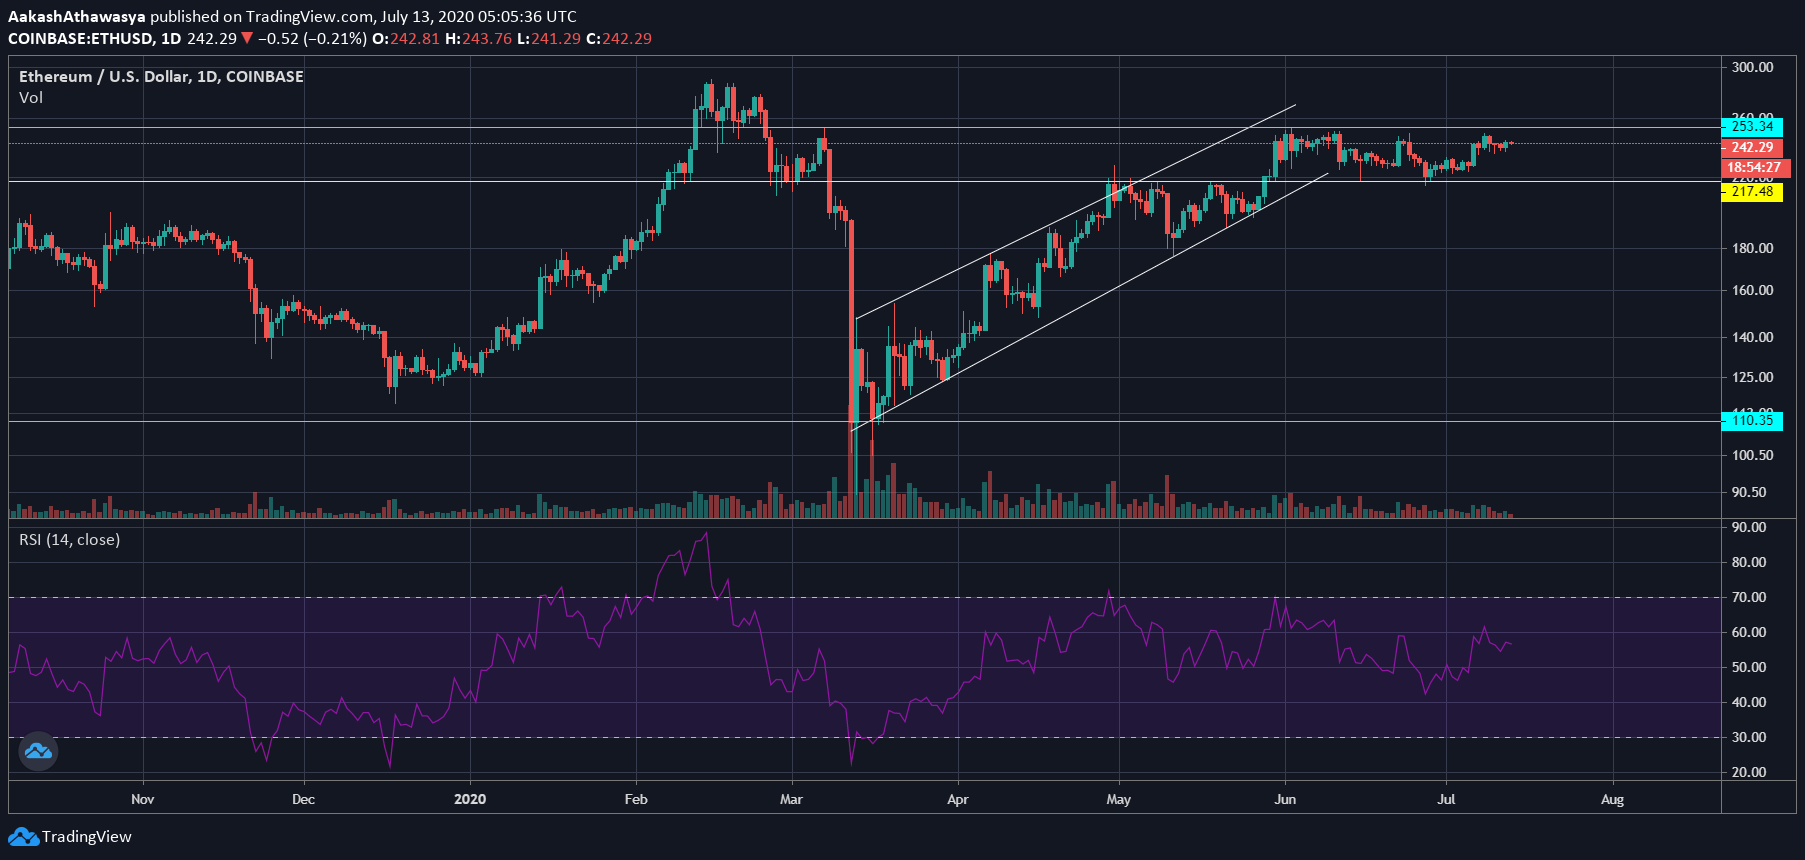
Source: ETHUSD via Trading View
Since that move, however, the price has been locked in a tight trading range between lower resistance-flipped-support at $217.5 to upper resistance at $254.8. On four occasions Ether tried to breakout of the zone on 1 June, 10 June, 25 June and 7 July, each successive occasion saw lower volume, and mounted lower highs.
It should be noted that within this sideways trading, Ethereum community was marred by two distinct pieces of news. Firstly, a transaction on June 10 saw 0.55 Ether worth $133 transferred for a fee of 10,688 ETH or $2.58 million, and secondly, there were fears of an ETH-dump from the Plustoken scam as $187 million in ETH was transferred to an unknown wallet on 24 June.
Relative Strength Index [RSI] for the altcoin has been trending at 56.68 which is a healthy sign. However, it has dropped from the high of 70, which it saw when it first entered the tight trading zone. Support and resistance at $217.5 and $254 are holding strong, and a dip below or above them will have to be accompanied by strong volume for a larger move to manifest, till then the zone will persist.