
Ethereum has hit a level last seen almost 2 years ago and not just that, it has held the level successfully. The $415-level is now acting as a support for the next leg, which is a bullish one.
At press time, ETH was still the second-largest cryptocurrency in the world with $47 billion in market cap and a staggering $12 billion in 24-hour trading volume. The coin was noting a decline of 0.16% over the aforementioned period and more might be on the horizon before the next bullish move begins.
ETH’s Weekly Chart
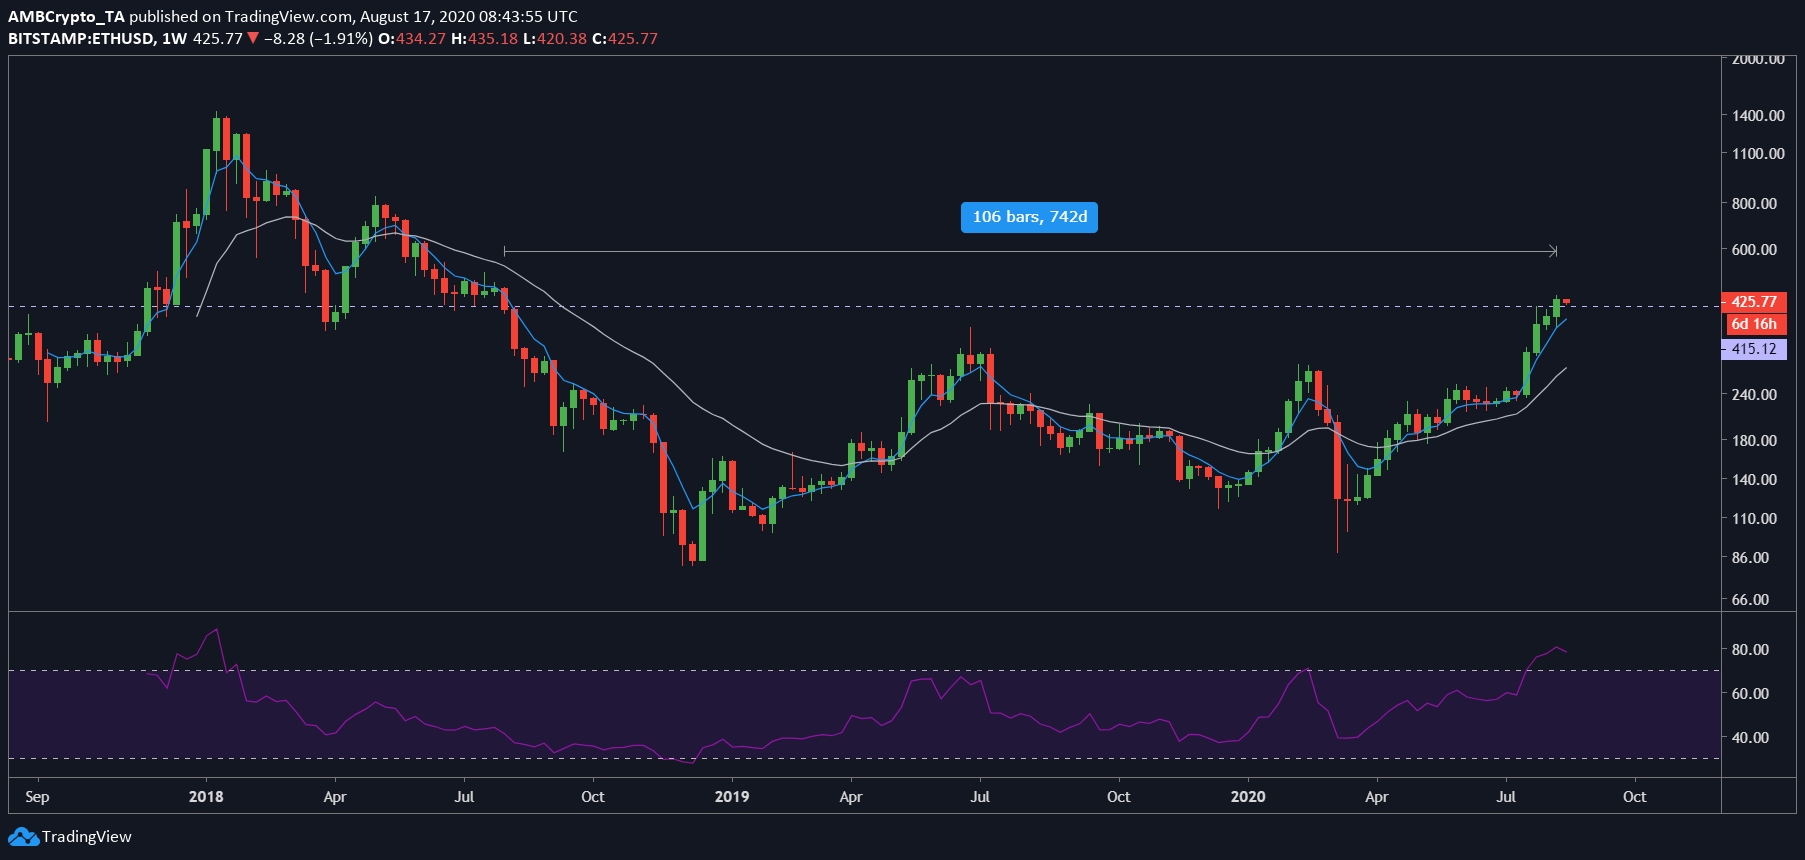
Source: ETHUSD on TradingView
On the weekly time frame, the weekly candle successfully closed above the $415.12 level. The present candle started today and needs to close higher than the $415 level to be bullish and to continue the trend. In fact, it would be even more bullish if this candle closes higher than the high of the previous candle.
Additionally, the RSI indicator was heading into the overbought territory with 4 consecutive weekly surges on the charts. It is likely that the RSI will soon move towards the 70-mark in the overbought zone.
In fact, the 5-Weekly MA [blue] will act as a support to ETH’s price, should it drop lower on the charts. Further, the 21 WMA [white] was observed to be far below the price, an indication of the momentum that has accompanied ETH’s recent surge.
Ethereum’s Daily Chart
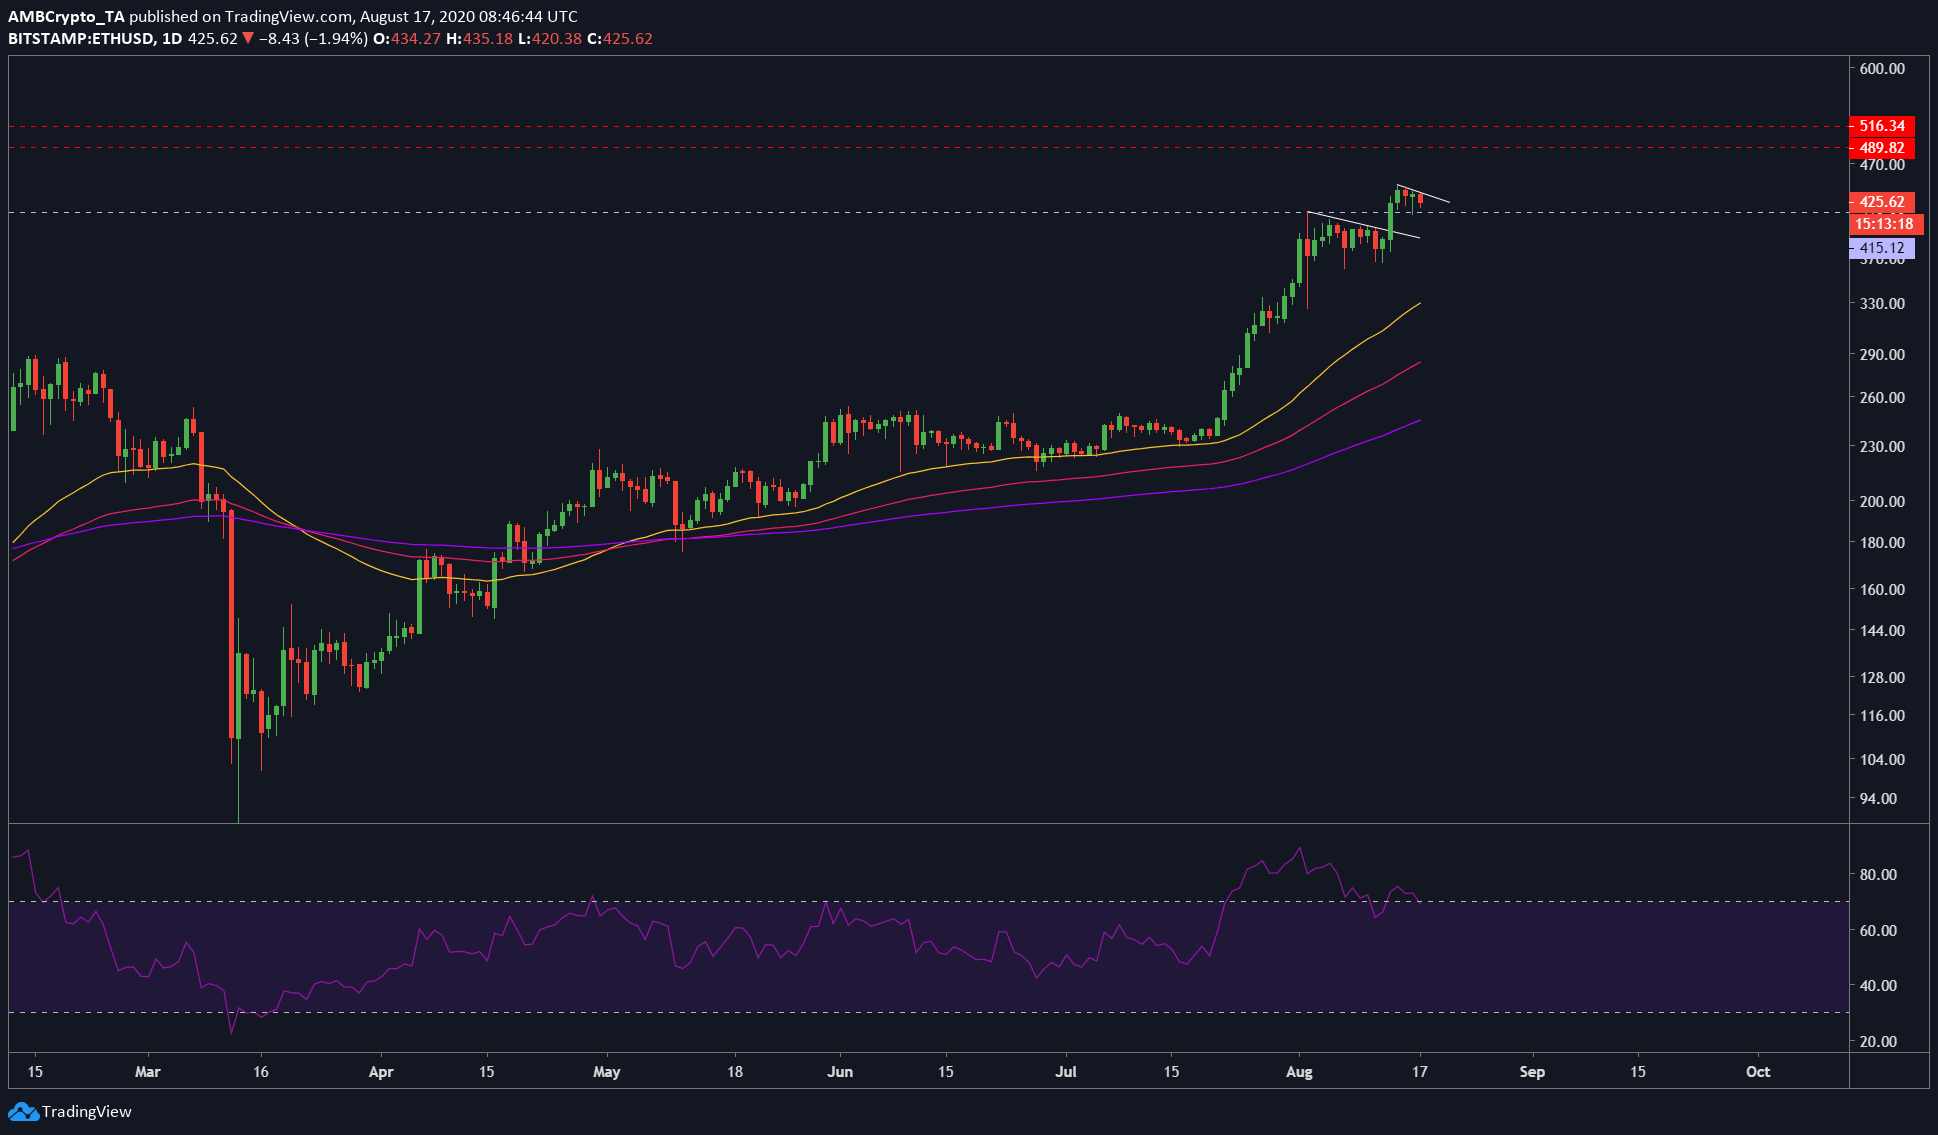
Source: ETHUSD TradingView
The daily time frame for Ethereum showed a different view of its price and what to expect next in the near-term. The surge that pushed the price to test the $415-level had noted a small decline, before actually breaching the level. A similar decline in price with lower highs was being formed, at the time of writing, a formation slightly similar to the bullish flag, continuation pattern. Hence, expecting a pump here wouldn’t be out of order.
The expected pump in the altcoin’s price can push it to as high as $489 and/or $516. These pumps are about 14% to 20% higher than ETH’s press time level. It must be noted, however, that due to the bearish divergence, a brief drop under the $415 level can also be expected.