
Disclaimer: The following price prediction should not be taken as investment advice as it is the opinion of the writer. The prediction should materialize in the next couple of weeks.
Mainly mirroring the end of July, the end of August seemed to have kickstarted another bullish rally for Ethereum. From the 2nd week of August to a few days back, Ethereum’s decline was extremely evident, considering the fact that DeFi tokens based on its platform were noting all-time highs. However, better later than never, the largest altcoin is currently experiencing another yearly high valuation after breaching past $443 over the past 12-hours.
At press time, Ethereum’s market cap clocked over $52 billion with 9.20 percent over the past day.
12-hour chart
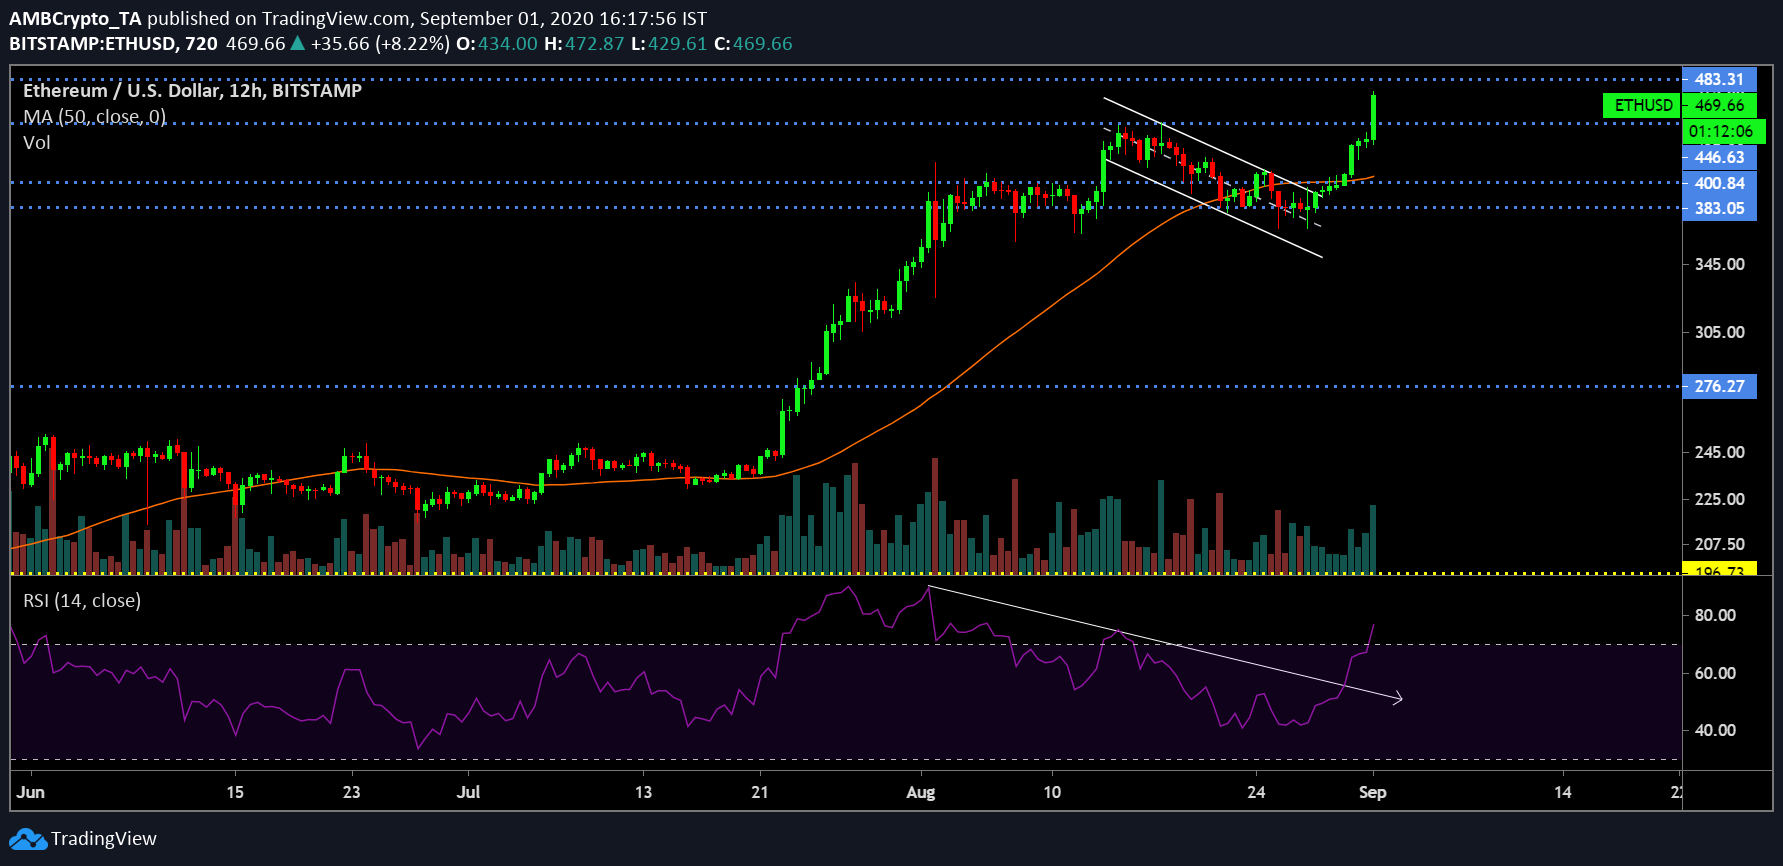
ETH/USD on Trading View
On analyzing the above 12-hour chart, the breakout entertained by Ethereum is a classic bullish reversal from a descending channel pattern. The past few day’s sideways movements between $383 and $400 were extremely crucial with Ethereum bouncing back from $370 at the end. Since 27th August, it has been an up-hill battle for Ethereum. Breaking out of the descending channel, the asset consistently breached past its resistance at $400, $415, and $446 to attain a position near $470.
The change in trend exhibited by the Relative Strength Index or RSI was also significantly helpful, as buyers flocked back into the ecosystem with a bullish vigor. The only thing to watch out for remains the lack of volume at the moment, as Ethereum’s incline movement did not attain strong volumes.
Other than that, the 50-Moving Average offered significant support at press time, concluding another bullish factor for the digital asset.
Ethereum 1-week chart
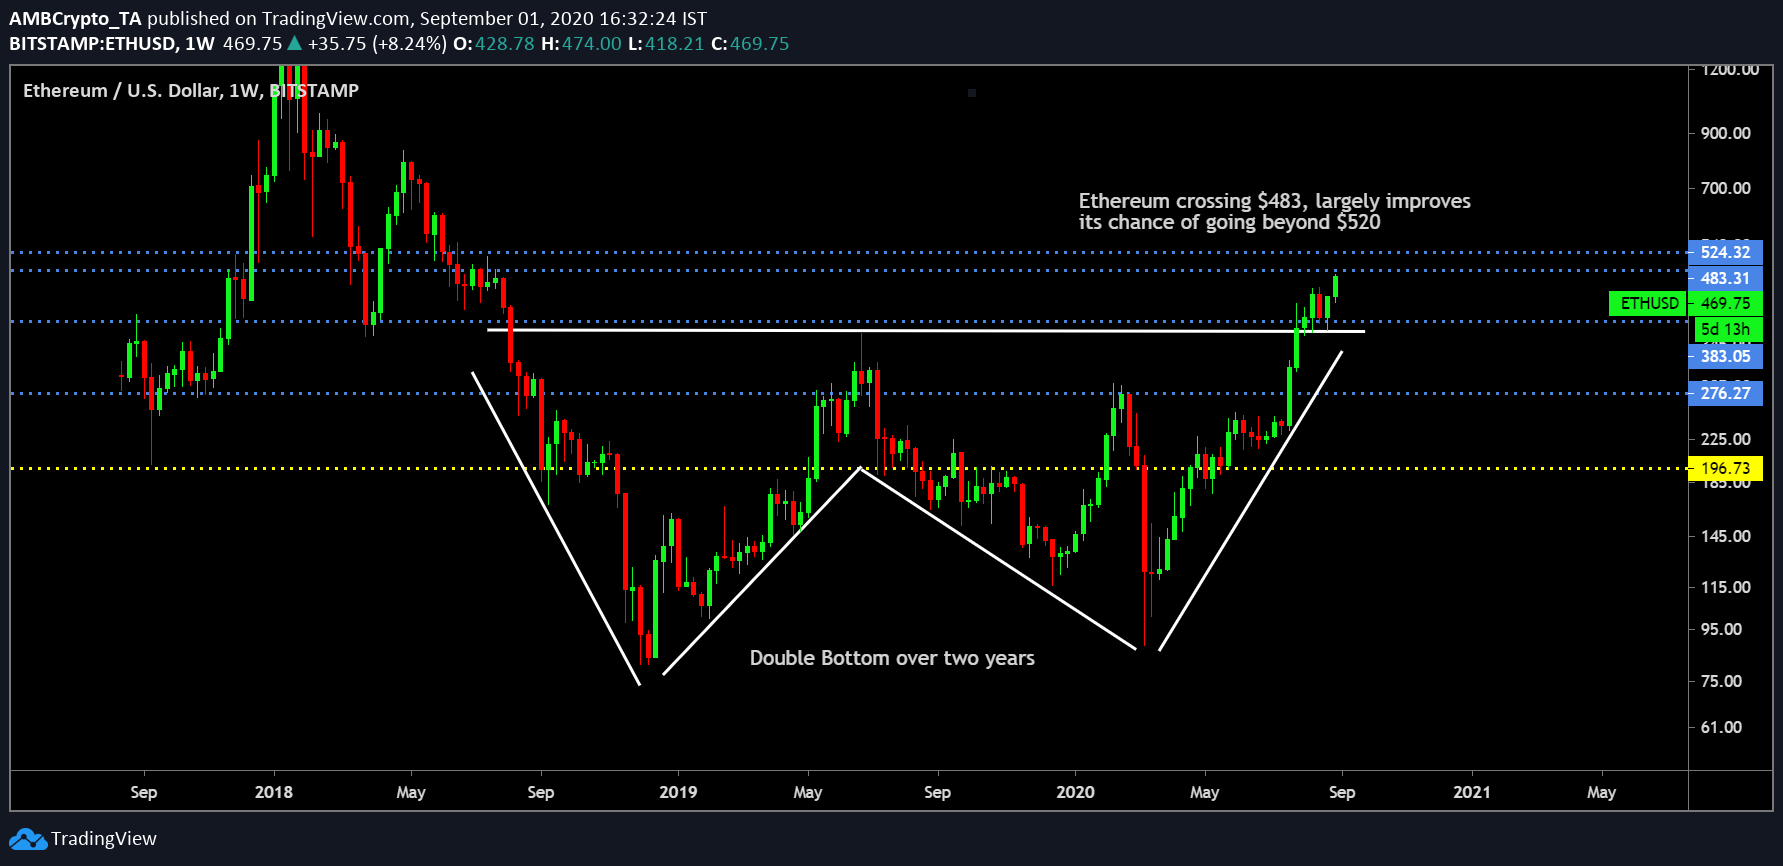
ETH/USD on Trading View
The weekly chart of Ethereum may have completed a bullish breakout of its own. As witnessed in the above time-frame, for the last two years, Ethereum’s price movement has led to the formation of a double bottom pattern. The first was observed in late November 2019 and the recent one was observed in March 2020. The neckline was identified at $383 and now over the past 3 weeks, Ethereum has closed its position above the range. The trend overall was extremely bullish and considering Ethereum marches past $483 in the next couple of days, the next weekly resistance is present only at $524.
Hence, moving past $500 would only be a formality if a position above $483 is completed.