Disclaimer: The findings of the following article are the sole opinion of the writer and should not be taken as investment advice
In a previous article, Ethereum’s make or break moment was explained as the cryptocurrency’s price nearly broke out of the massive bearish pattern. Since then, a lot has changed for Ethereum and this article will focus on what we can expect next.
Ethereum 1-day chart
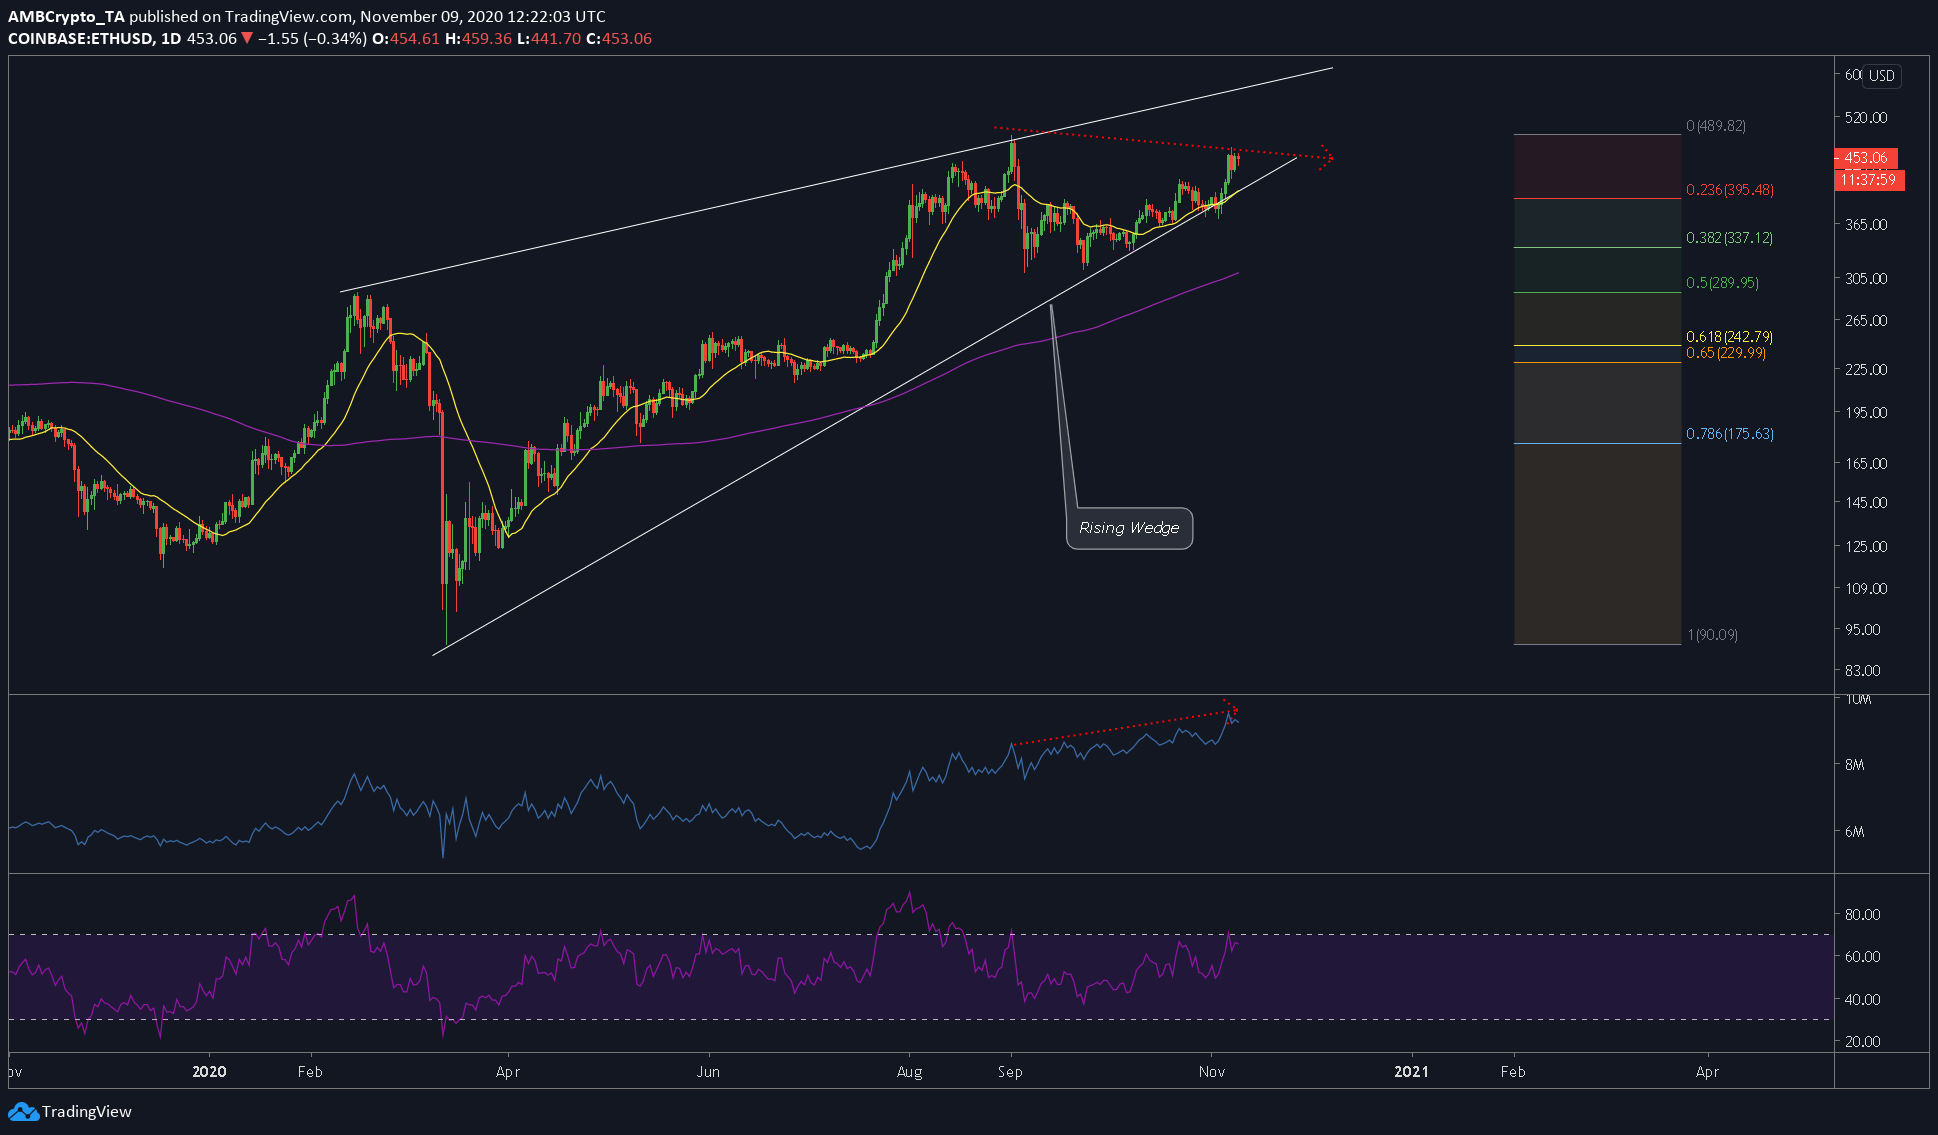
Source: ETHUSD on TradingView
Ethereum’s price was about 7-10% away from reaching its local top of $488, at press time. The local top was last seen on 1 September, and the price was taking another jab at the same. At press time, ETH was priced at $456 and showed signs of the market bulls recovering, but they won’t last for long.
The setup, like last time, is still bearish and for similar reasons.
Rationale
The rising wedge pattern, in and of itself, is a bearish pattern. That’s not all either as it’s important to consider the indicators too. The RSI was toppy on the charts, with the same observed to be around the 70-level [overbought].
What is interesting here is the OBV indicator [on-balance volume]. The price formed higher lows while the volume indicator did the opposite – it has been rising, despite the cryptocurrency’s price drop. This was a hidden bearish divergence and suggested that the price will soon drop.
Ergo, the question is – To what extent?
Conclusion
As for the levels, on a macro scale, the 0.236-Fibonacci level [$395.48] seemed to be a good resting point for ETH, at least in the short-term. Subsequent levels of 0.382 [$337.12] and 0.5 [$289.35] are also good levels for the price to find support.
Other levels include the 20-day moving average [yellow] and the 50-day moving average [purple]. The 20-day moving average is the immediate support at $408, a little above the 0.236-level.
There are two possibilities – The price will concur with the bearish divergence and head lower, or it will climb higher. For now, all evidence points to a short pullback. Hence, we can expect Ethereum to drop lower on the charts.