
Most altcoins do not have two legs to stand on. Non-specialized altcoins rarely brush the limelight with isolated pumps and dumps, while others rely on the price movement of Bitcoin. And when the king coin volatility runs dry, investors dilute their alt-bags. Such is the case for most altcoins, but not for the largest one of the lot, Ethereum.
The second-largest cryptocurrency in the market, unlike the rest of the minority coins, has been finding its feet. Whether that be from the threat of Plus Token dump or a transaction fee error, Ethereum has seen its own movement. However, this movement, which had been consistently bullish till June taking the price of Ether as high as $250 is now trading sideways.
Since dropping to double-digit lows in March 2020, following Bitcoin’s Black Thursday fall, Ether traded in a strong upward channel, forming higher highs and higher lows with each subsequent week. From 26 May to 2 June, the altcoin’s price surged by 25.7 percent, taking it from below $200 to $252, while the rest of the market traded flat. But since Ether hit the support level at $253.47, a level which it last broke in late-February only to be pushed back down on 6 March, a week before ‘Black Thursday,’ it has entered a parallel channel. On the lower end of the channel lies support at $217.48, which had been brushed on 28 June, and since then the price has been rising over the past week.
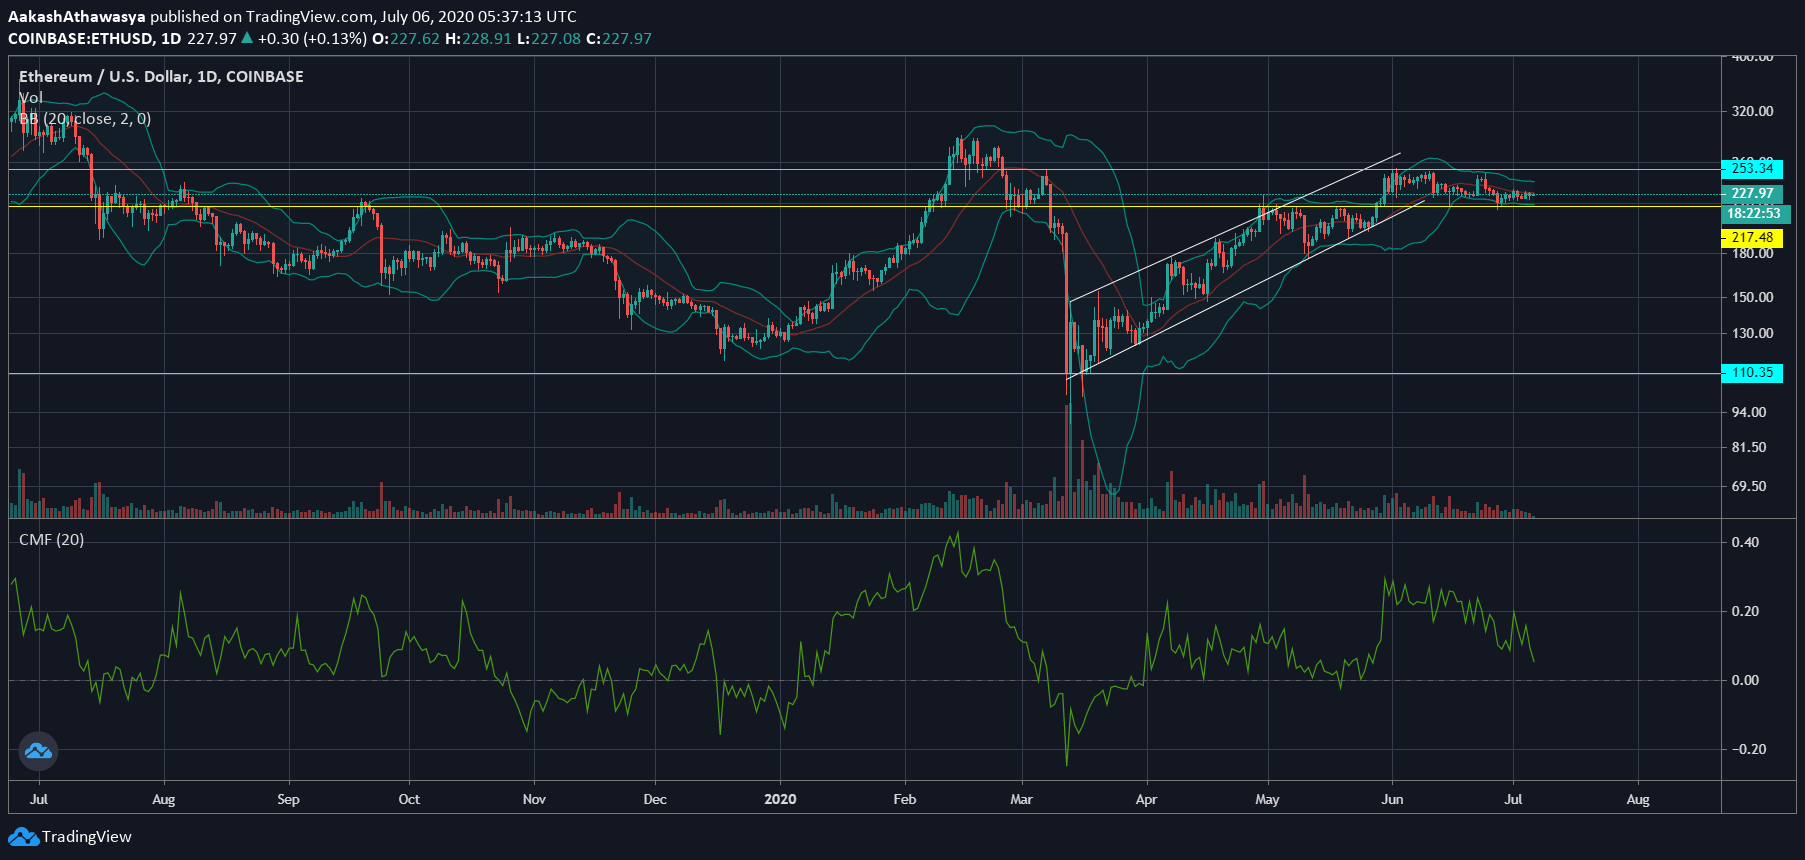
Source: ETHUSD via Trading View
Give the recent stability Ethereum has been seeing, its 24-hour trading volume has decreased. At press time, Coinmarketcap points its 24-hour trading volume at $5.24 billion.
Unsurprisingly, Bollinger Bands for ETH are tightening, and have been since 24 June. However, the simple moving average of the same, which was below the bands for the past week, is now in line with the current day’s candlesticks. Chaikin Money Flow [CMF] tool has been trending downwards since the beginning of June and now is at 0.06, its lowest point since 25 May. The last time Ether saw a negative valuation on its CMF was in March, when the price was recovering from below $100.
Stable movement might not be a very bad thing for Ethereum, especially in light of the fact that Bitcoin has been trading in a set range since early May, even before its halving. But in times of low volatility, healthy volume matters, Ethereum’s daily volume is 40 percent that of Bitcoin’s. That being said, if ETH’s price continues to trade within the $217 to $253 zone with enough volume, it could ride the coattails of a Bitcoin move and return to its upward channel.