
After spending the first half of December above the $140 mark, Ethereum dropped by 18% over the two days since December 16. While the coin has made efforts to rise up to the $134 level since, rejection at the resistance level has been brutal, pushing ETH down to $125 at the time of writing.
Ethereum 1-hour chart
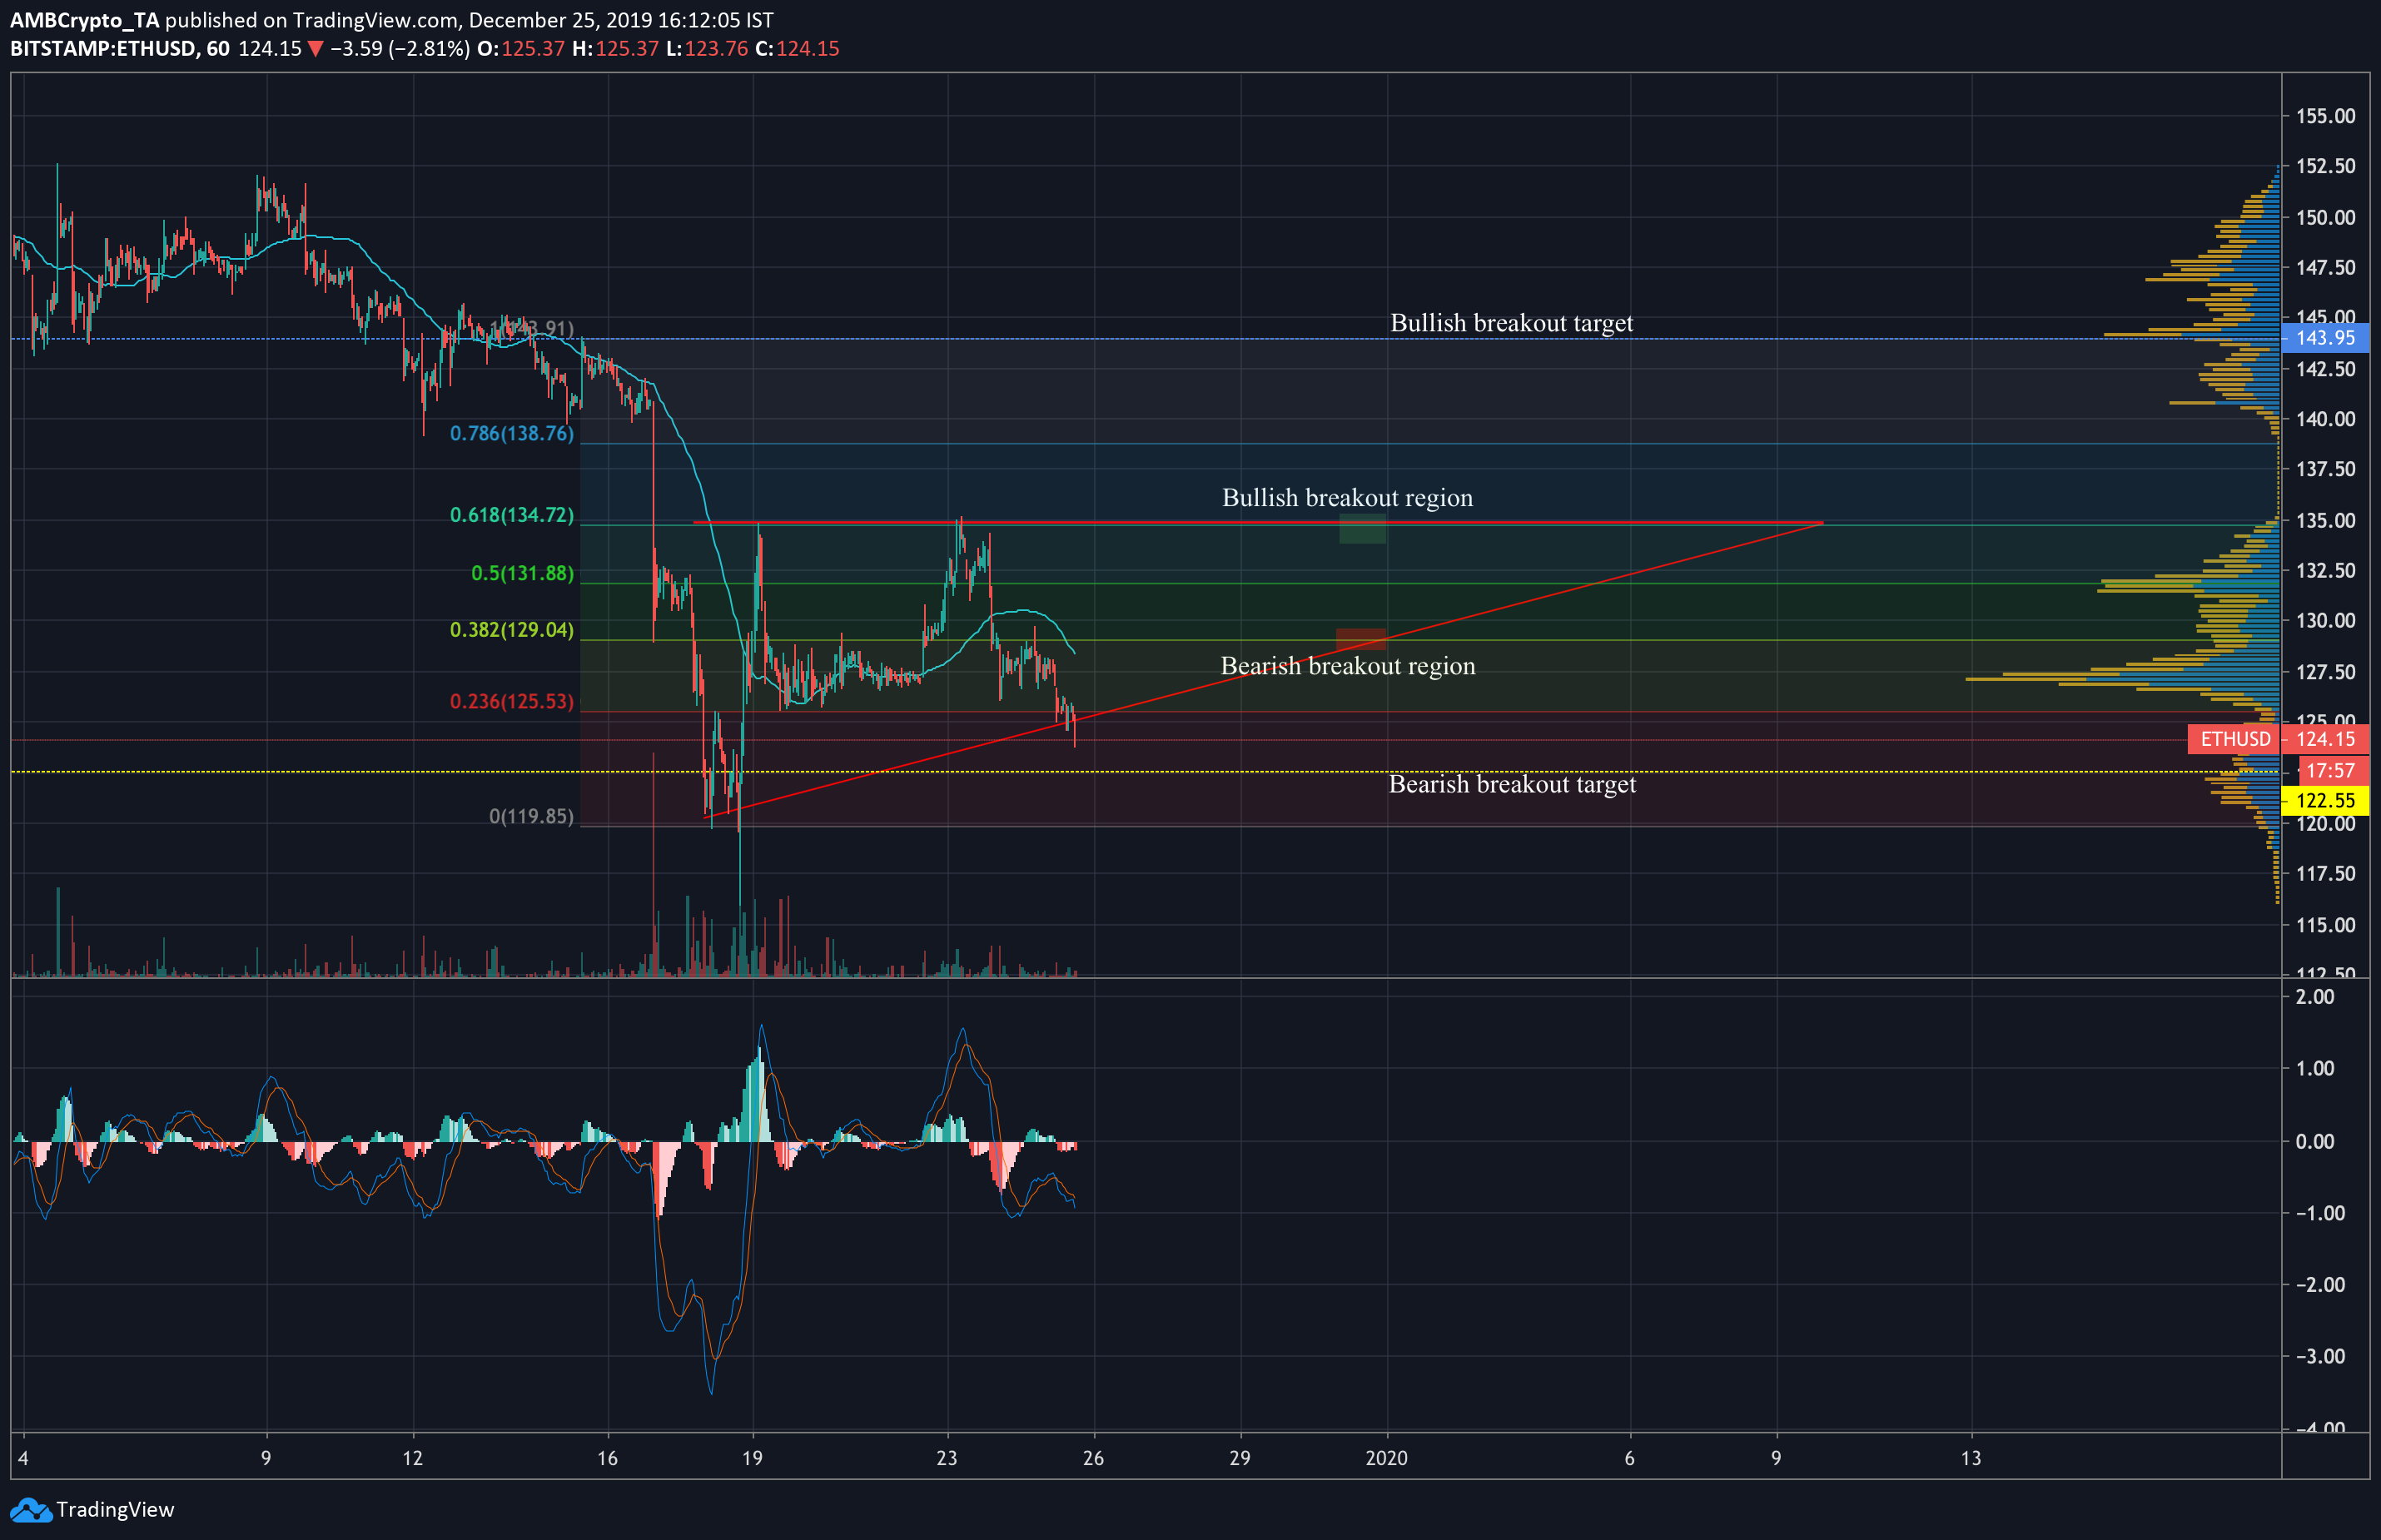
Source: ETHUSD on TradingView
ETH entered an ascending triangle formation during the aforementioned drop, as can be seen in the hourly chart above. The pattern can also be seen accompanied by a decreasing volume trend, which is characteristic of ascending triangle formations. These patterns usually exhibit trend reversals, and since ETH entered through a bearish move, an upward-facing breakout seems like a plausible outcome.
However, ascending triangles only produce upward breakouts in 63% of cases, meaning a move further down is also possible, albeit less likely. MACD indicator showed slight bearish momentum, with the signal line hovering over the MACD line, just above the -1.00 mark.
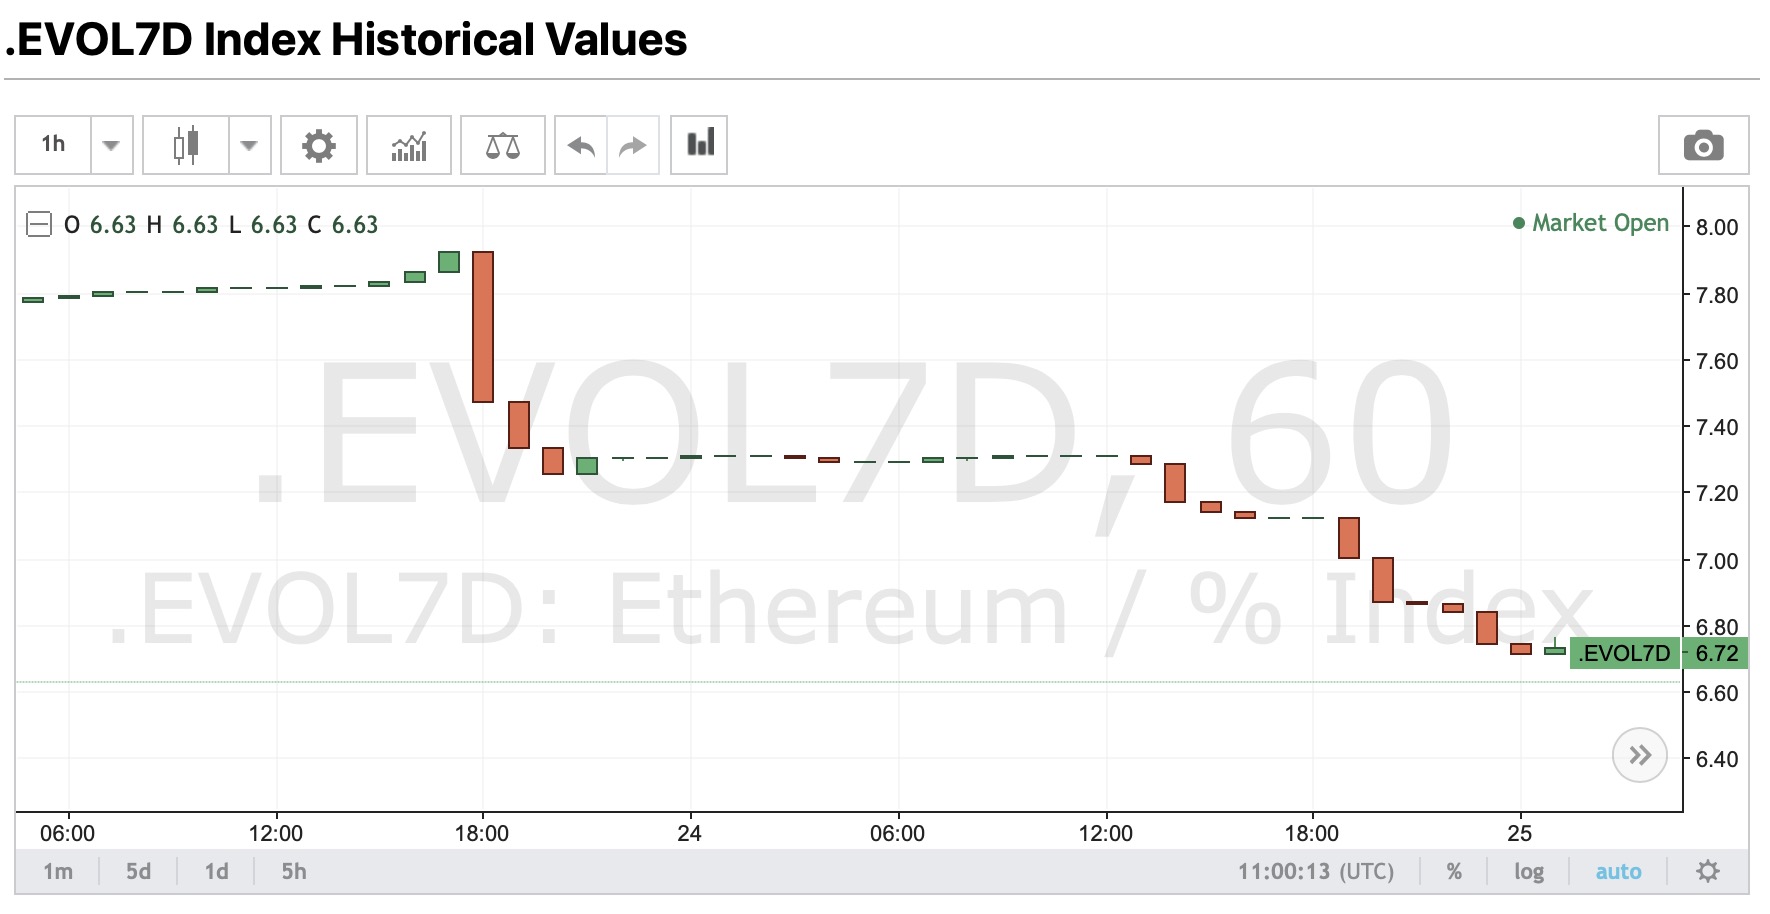
Source: BitMEX
The .EVOL7D Index from BitMEX, which calculates a weekly measure of ETH volatility, reported a drop to 6.63 from 7.92 seen just two days prior. This drop in volatility likely means large price swings are not in store for Ethereum’s short-term, and that ETH will likely make slow and steady movements in a certain direction. While the latest candle hasn’t breached under the pattern boundary, it has crossed under the 23.6% Fibonacci retracement line.
Ascending triangles tend to exhibit breakouts around 60% of the way to the triangle apex, leading to the conclusion that a breakout will most likely occur in the final days of December. An upward move from the bullish breakout region could see ETH rise up to the 100% retracement level, while a downward breakout would drop its value further down to $122, near the local high volume node on the volume profile.
Conclusion
Despite mostly bearish movements being made in recent times, ETH looks to be fighting its way back up. Having tested the upper pattern boundary twice before, the third time could be the charm for Ethereum. The lower volatility and probability of trend reversal due to the pattern shape indicate that ETH will likely move up to $135 in the coming days, and break above the pattern boundary to $143 soon after.