
Since mid-July 2019, Ethereum has been unable to cross above 0.0227 BTC, priced at around 0.176 BTC at the time of writing. While the short-term looks like more downward for Ethereum, the long-term looks a little more optimistic, and could push ETH back above 0.02 BTC. At the time of writing, ETH was valued at around $144, and had a market capitalization of over $15.6 billion.
Ethereum vs Bitcoin 4-hour chart
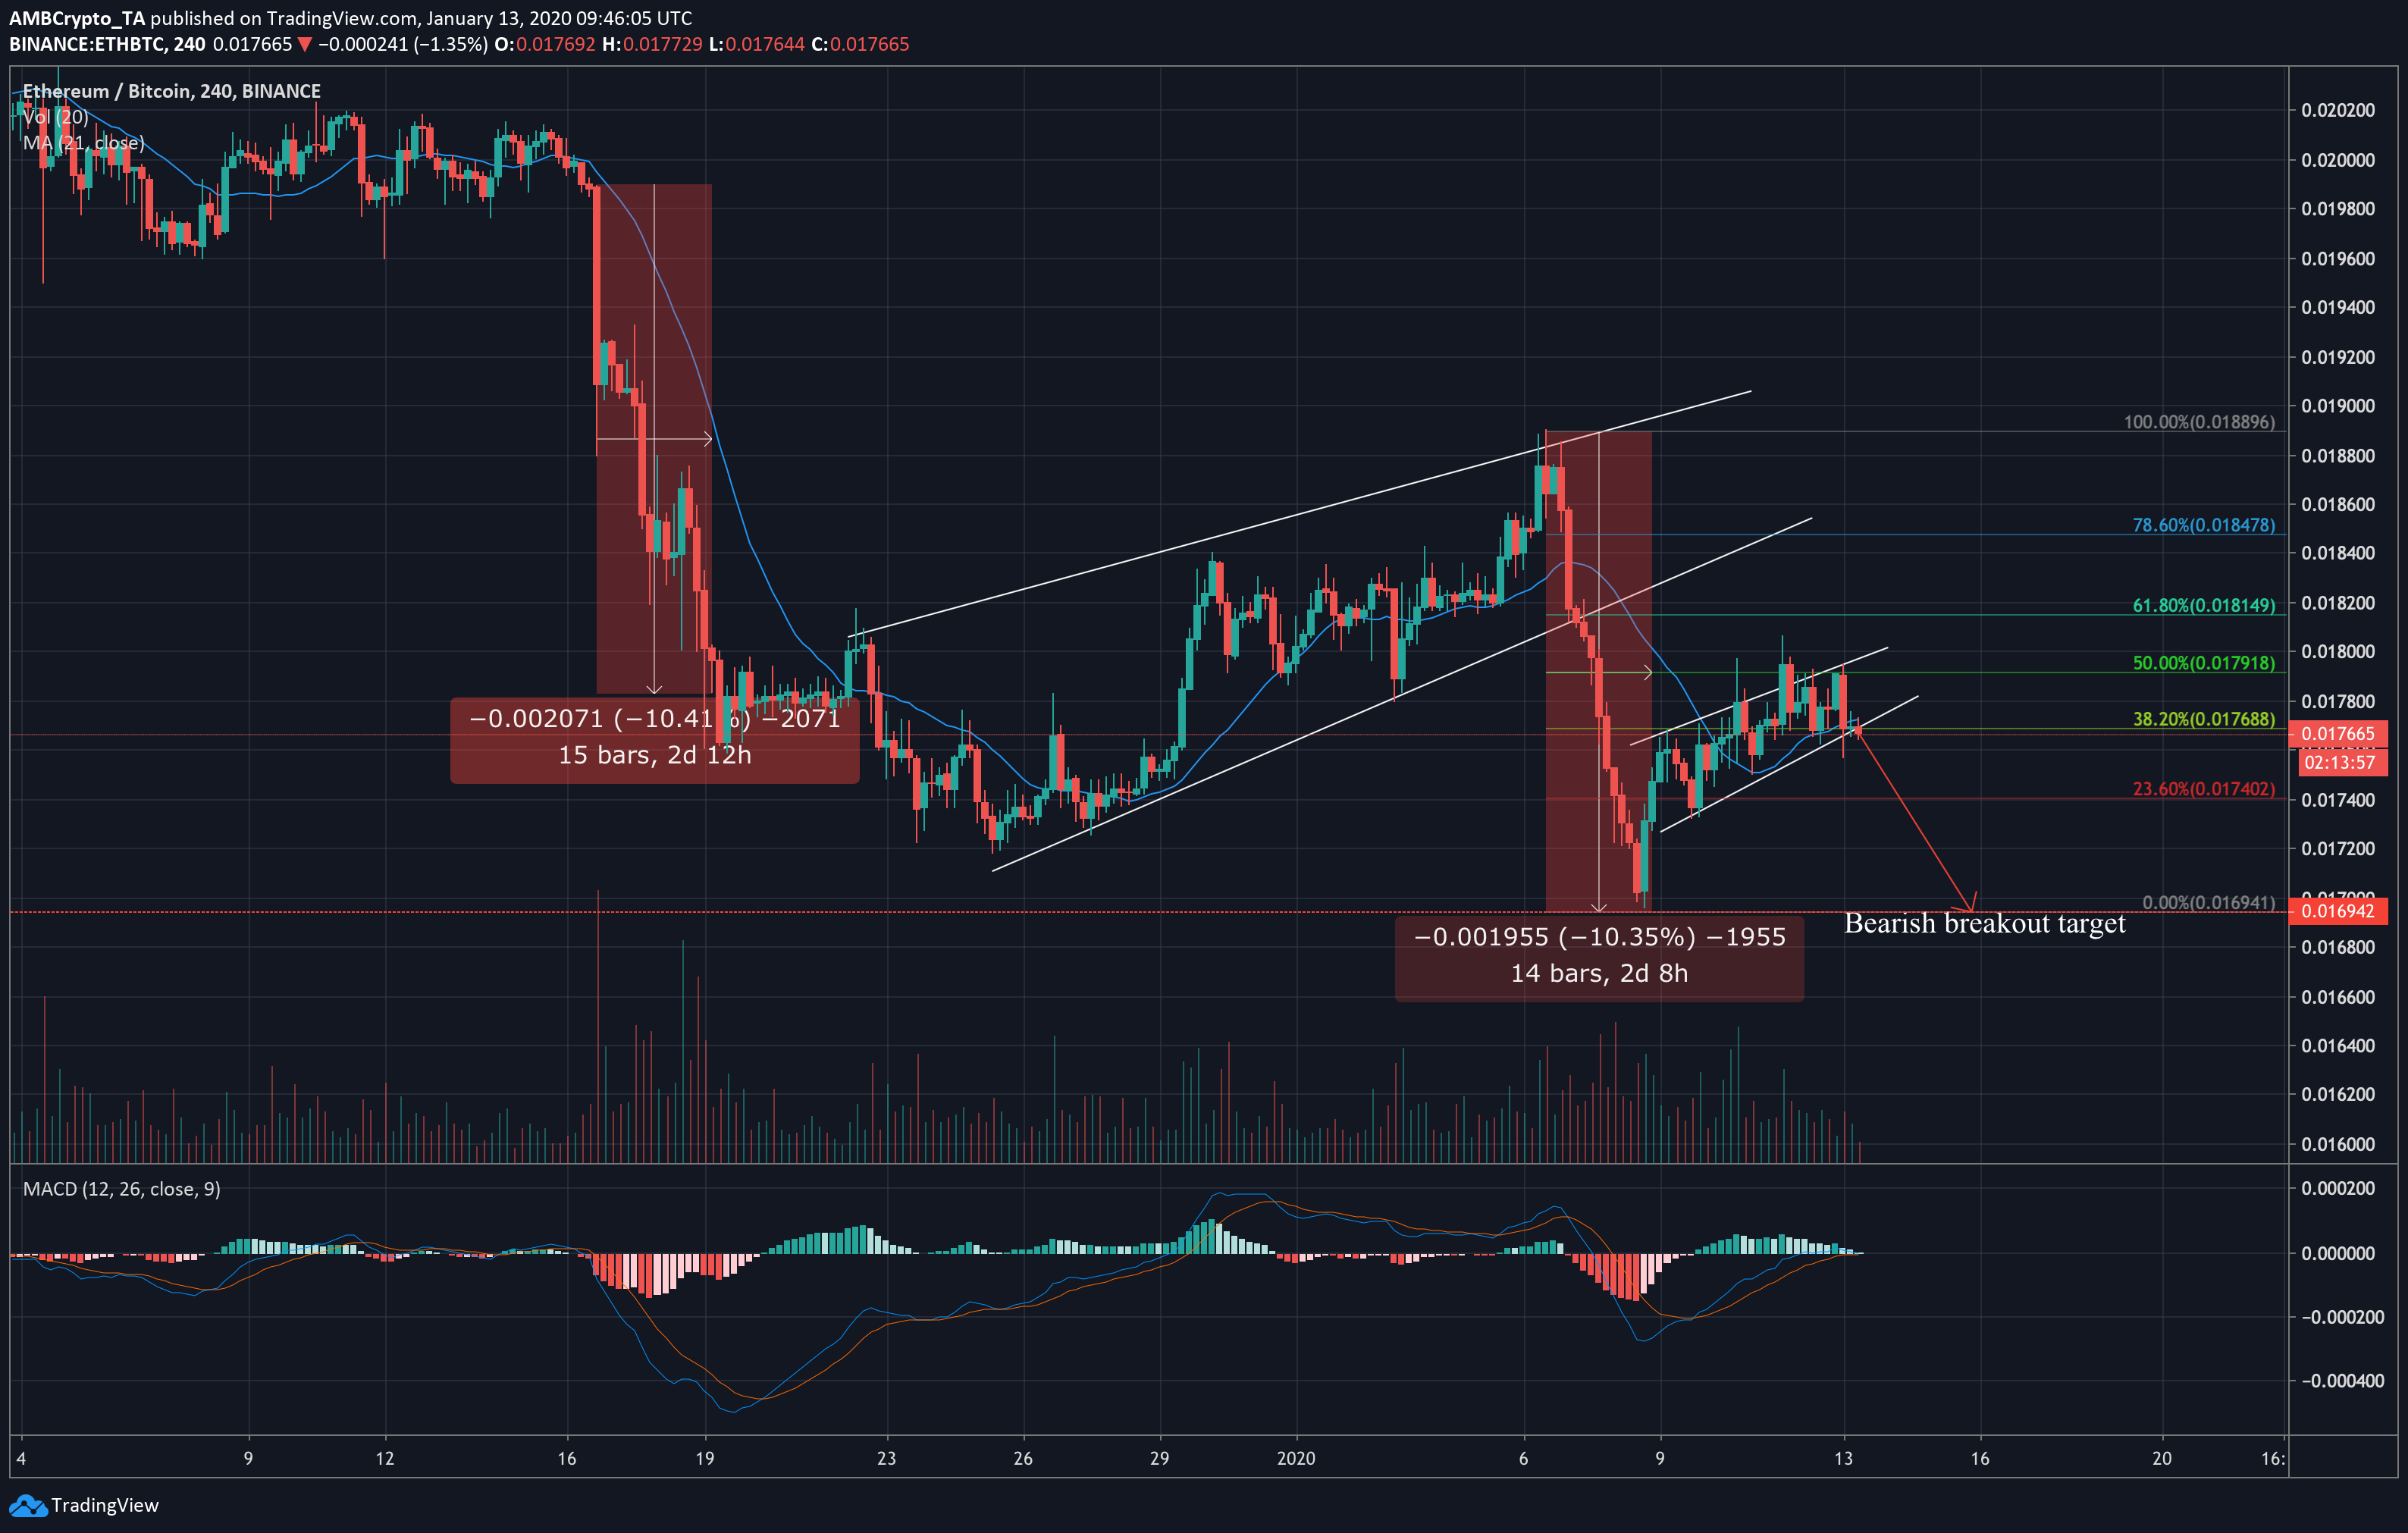
Source: ETHBTC on TradingView
On December 16, ETH fell by over 10.4%, from nearly 0.02 BTC down to 0.0178 BTC, in two and a half days. This drop was echoed recently, on January 6, where ETH dropped by 10.35% from 0.185 to around 0.169 BTC. In both cases, BTC had risen by 6%, causing the drop in ETH value against Bitcoin. However, both cases were followed by a rising wedge formation, as seen in the above chart.
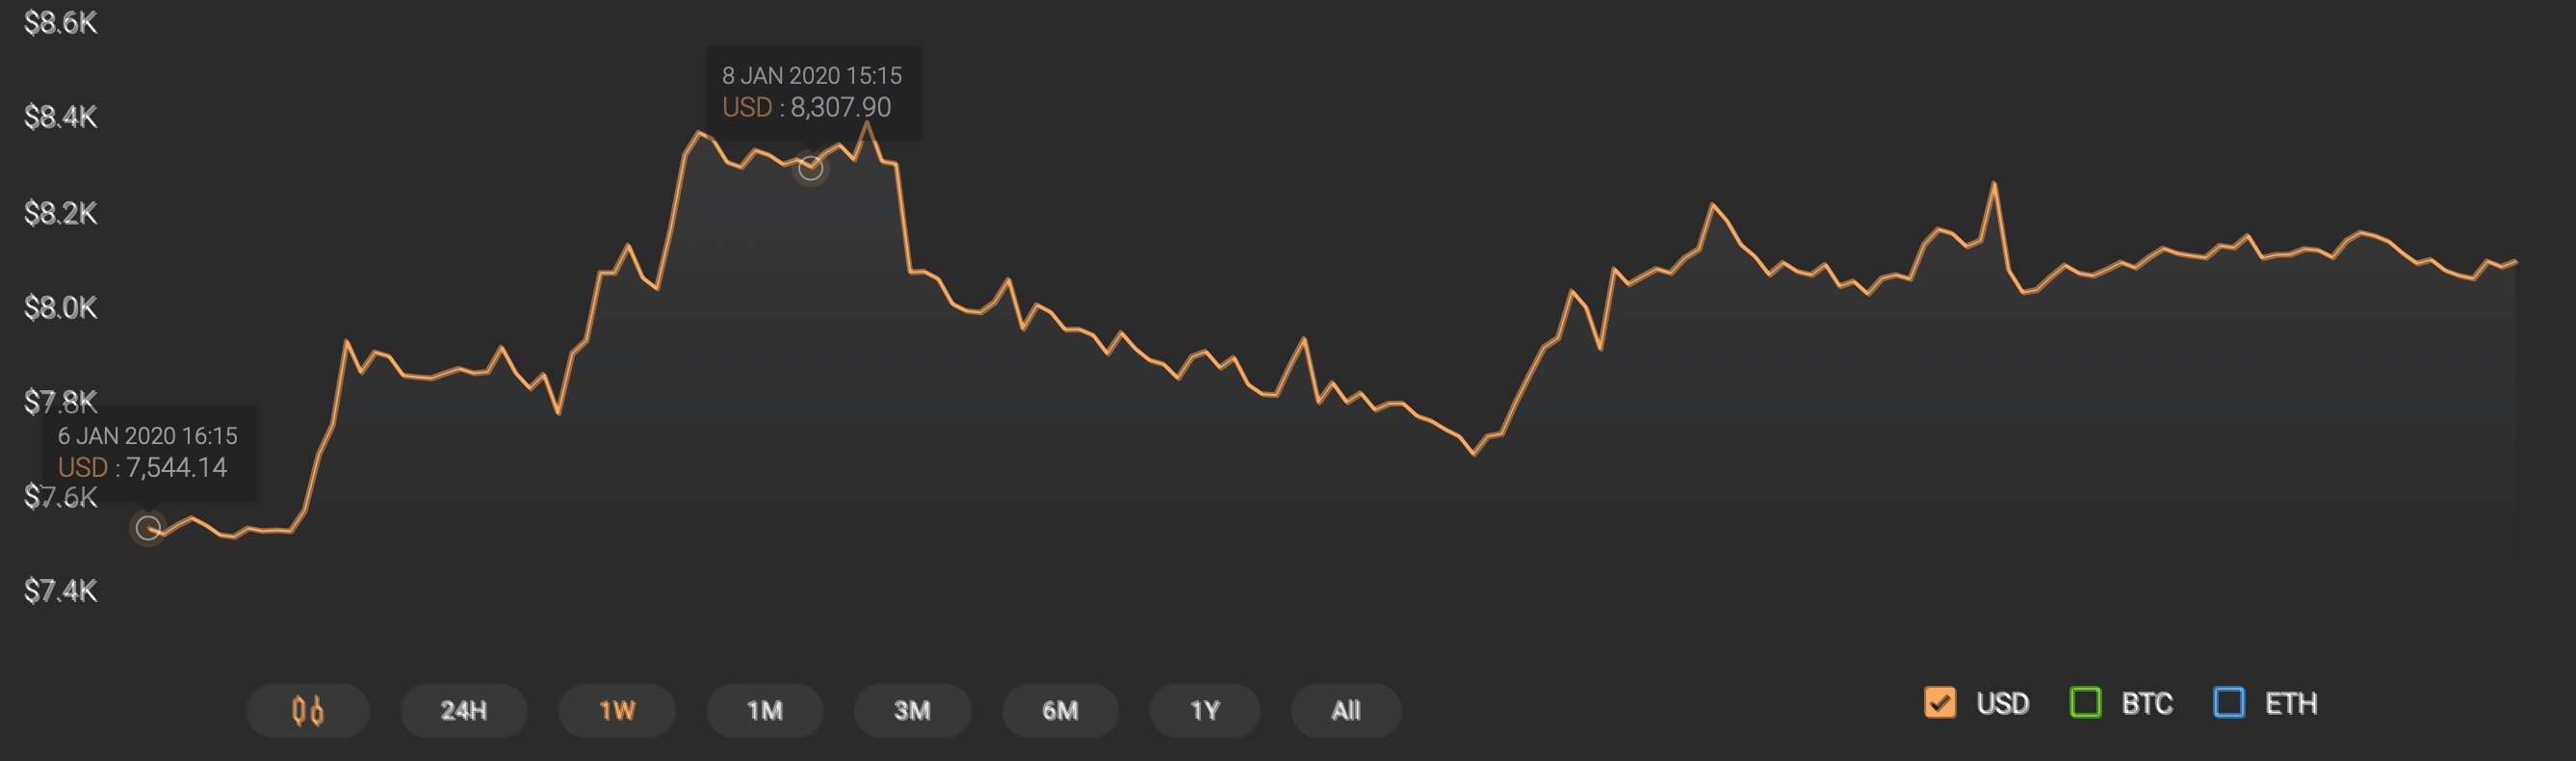
Source: Bitcoin on CoinStats
The 21-moving average was seen moving just over the latest price candle, which generally signifies a bearish market for the near-term. MACD, however, looked more optimistic, with the blue MACD line having maintained its position above the signal line since January 9. Although this is a typically bullish sign, the two lines looked to be converging around the zero mark, leading to the possibility of a bearish crossover.
Correlation with Bitcoin
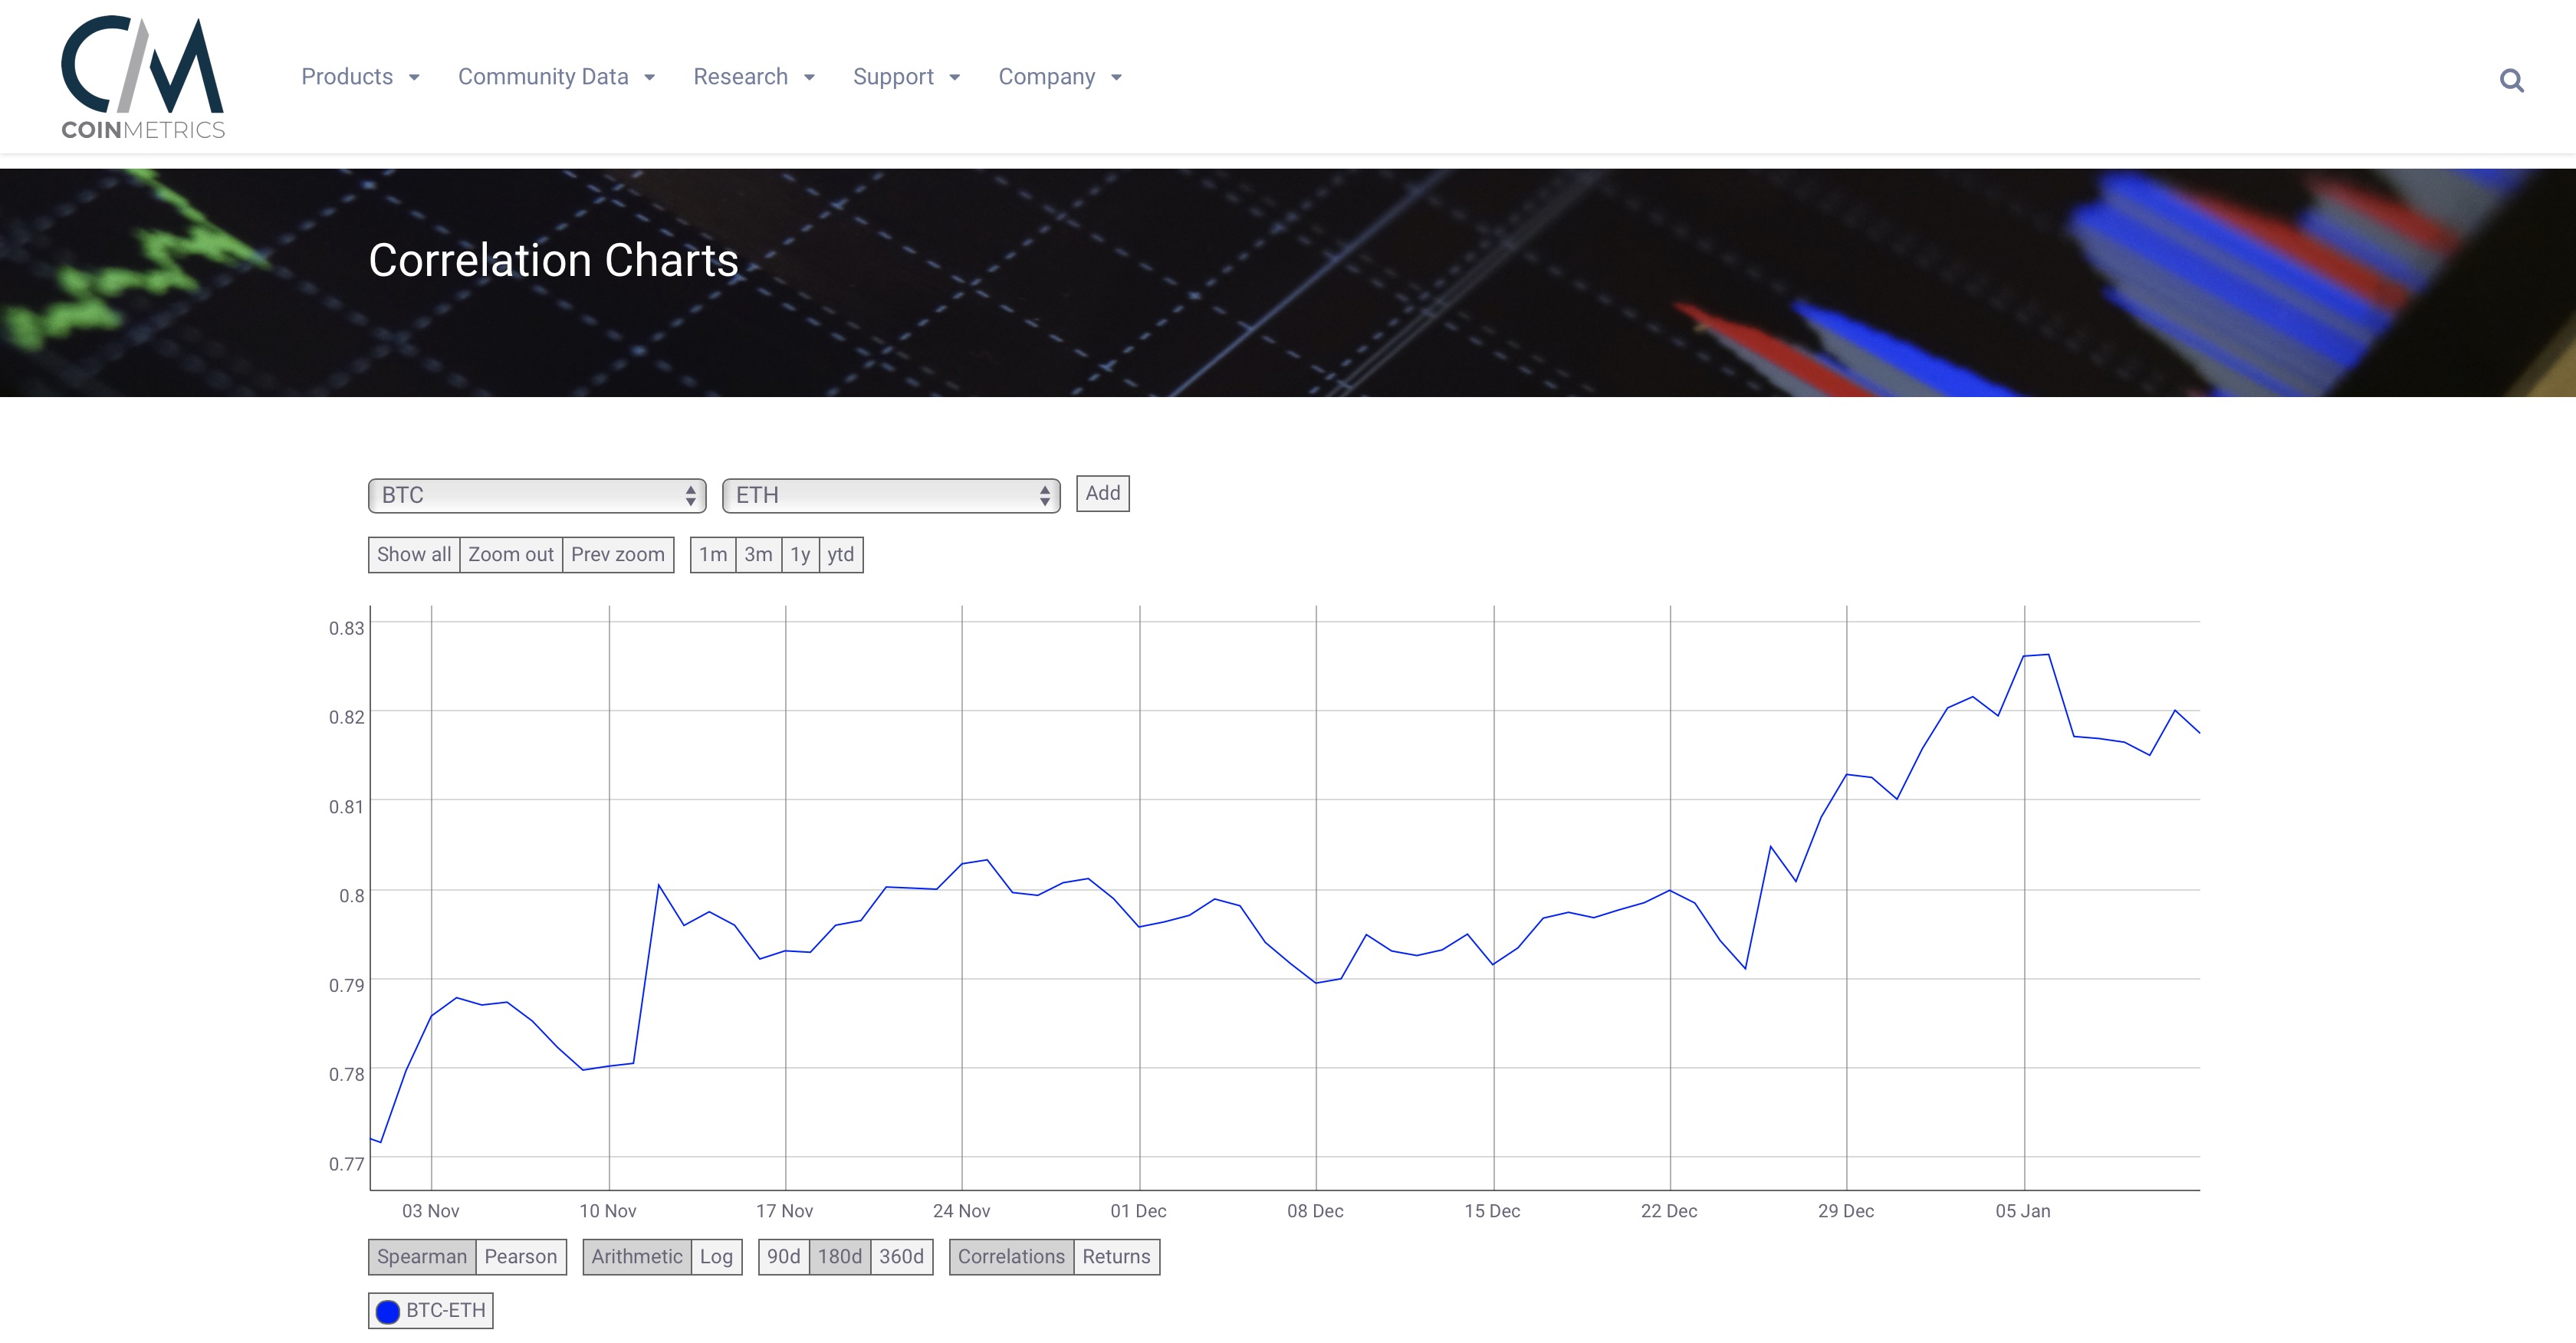
Source: CoinMetrics
While the signs seem to indicate a bearish breakout, all might not be lost for Ethereum in the longer term. Data from blockchain data analytics firm, CoinMetrics, shows Ethereum’s correlation with Bitcoin has been on the rise since early November. January 6 saw correlation dip a little, from 0.826 to 0.817, likely due to the aforementioned 6% rise in BTC over the period, but the correlation has risen since then. As Bitcoin is projected to move upward in the coming month, it seems plausible that ETH will too, though to a lesser extent. It’s also important to note that ETH has defied Bitcoin’s movements in the past, and correlation could vary more with time.
Conclusion
ETH is far more likely to break below the rising wedge formation, following in the footsteps of its December movements. The MACD lines converging, the price crossing below the 21-MA and historical movements, all point to a downward breakout. Also, rising wedge formations exhibit downward breakouts in 60% of cases. This could cause ETH to drop down below 0.0169 BTC, but that might not necessarily be a bad thing as long as Bitcoin continues to go up.