
The Crypto Fear and Greed Index was noting a figure of 86, at the time of writing, with the same over 80 for over a week now. Ethereum was on a strong uptrend and pulled back to a level of support while Cosmos looked set to register a small drop in price. Enjin, on the contrary, was strongly bullish as it appeared to break decisively past a level of resistance.
Ethereum [ETH]
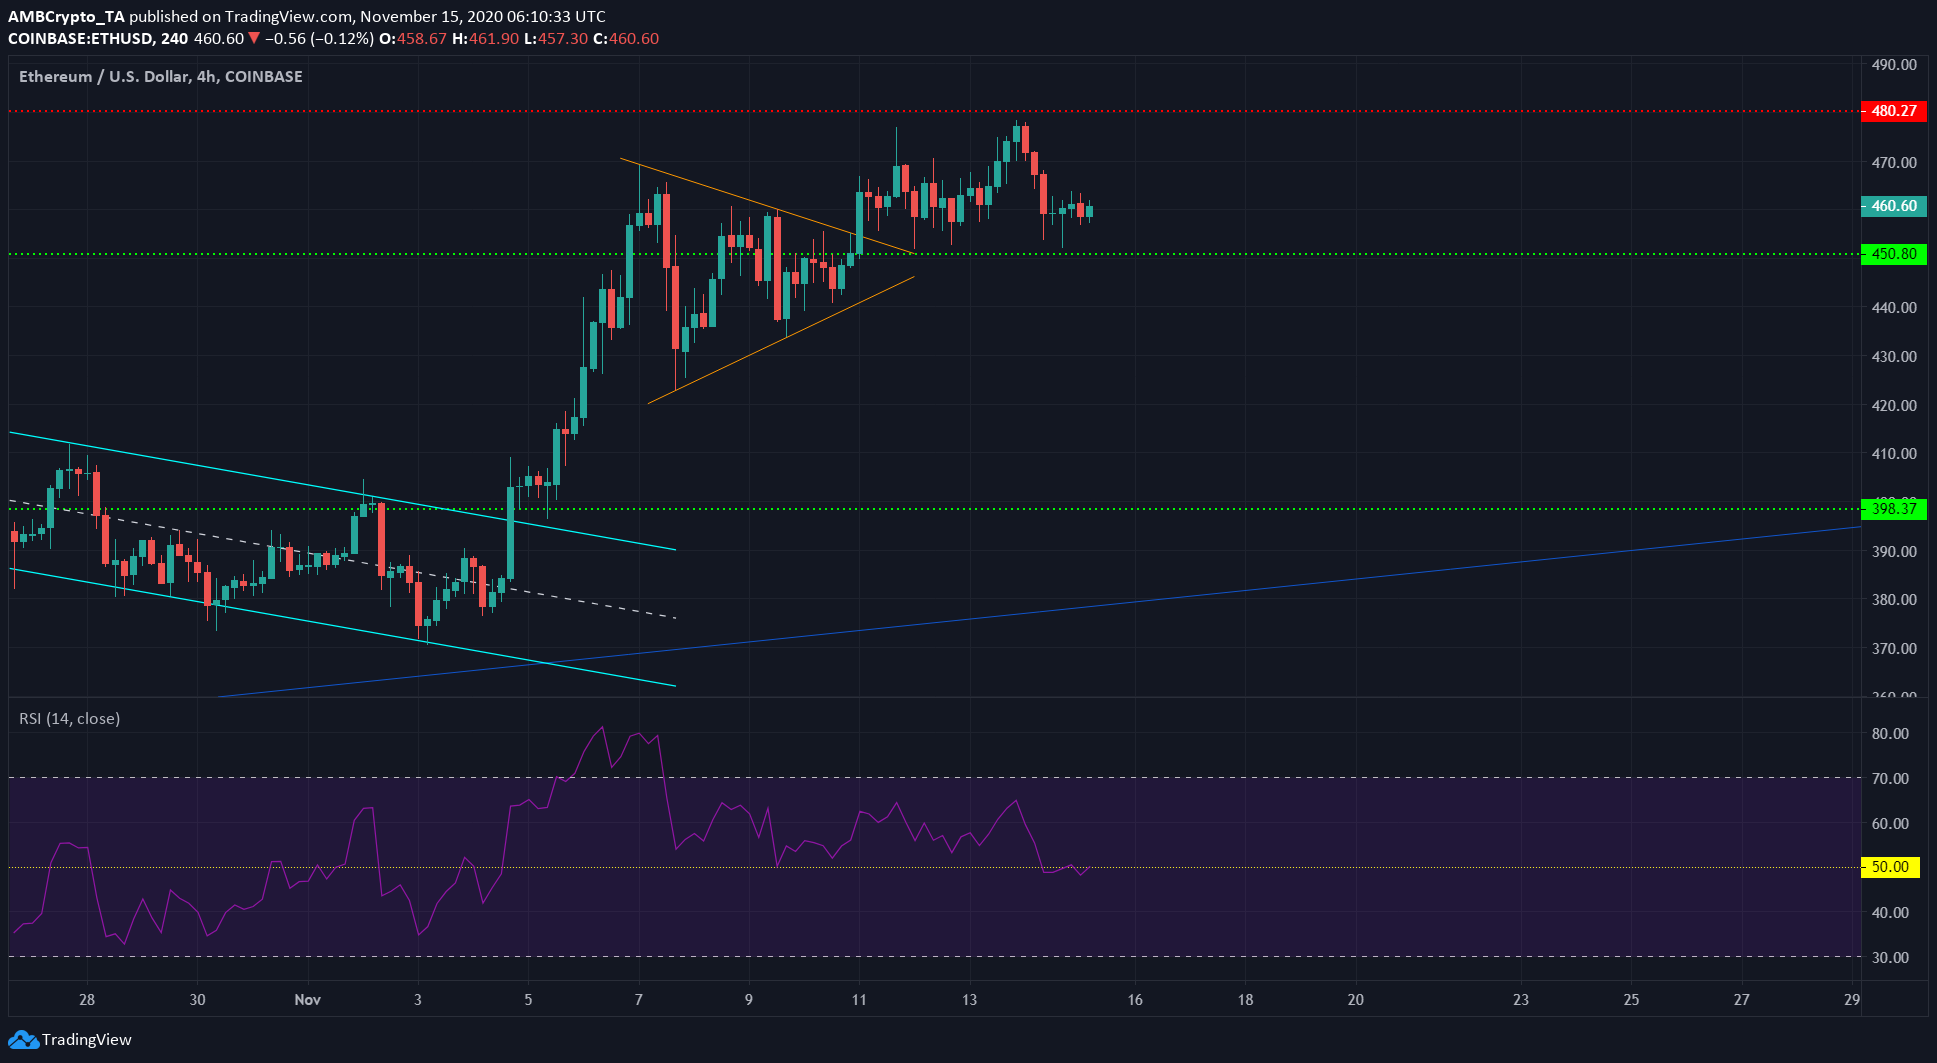
Source: ETH/USD on TradingView
Ethereum broke out of a symmetrical triangle (orange), a continuation pattern that saw ETH rise towards its resistance around the $480-region. However, selling pressure soon mounted and ETH was forced back to $460.
The RSI highlighted neutral momentum on the charts and it remained to be seen whether ETH can hold the $450-support. A close below $450 could see the price slide down to $420.
In other news, Binance recently announced the launch of BTokens – Wrapped Tokens on the Ethereum network.
Cosmos [ATOM]

Source: ATOM/USD on TradingView
ATOM retraced about 80% of its gains following its surge from $3.78 to $6.26. It bounced off the support at $4.32 and was making steady gains, but broke under the trendline support.
A rising wedge (blue) had also formed, implying that a drop in price was imminent after ATOM closed under the pattern. It could slide to the level of support at $4.8. If that failed, $4.6 also seemed possible due to it being a region of demand.
Finally, the MACD formed a bearish crossover and could be headed below zero over the next few hours. This would reinforce bearish momentum in the cryptocurrency’s market.
Enjin [ENJ]

Source: ENJ/USDT on TradingView
ENJ formed an ascending triangle (blue), a bullish pattern that generally indicates rising bullish momentum. The price broke to the upside of the pattern on strong volume and could retest the level at $0.143 to flip it to support and possibly offer an entry for traders looking for confirmation.
The projected target for this pattern was $0.162, although it was more likely that ENJ would move as high as $0.154 before meeting resistance.
The OBV also showed a spike in buying volume in recent hours, confirming that the bullish breakout had legitimate buyer interest behind it.