Analysis
Ethereum Classic joins the rally but Bitcoin SV, Maker struggle to keep up

The 3rd week of April has been a very active week from a trading perspective for the cryptocurrency market, with Bitcoin, the world’s largest cryptocurrency, finally breaching its resistance at $7500 on 23 April. However, while most of the asset class followed Bitcoin’s lead and capitalized on the bullish momentum, certain crypto-assets lagged behind.
Bitcoin SV [BSV]

Source: BSV/USD on Trading View
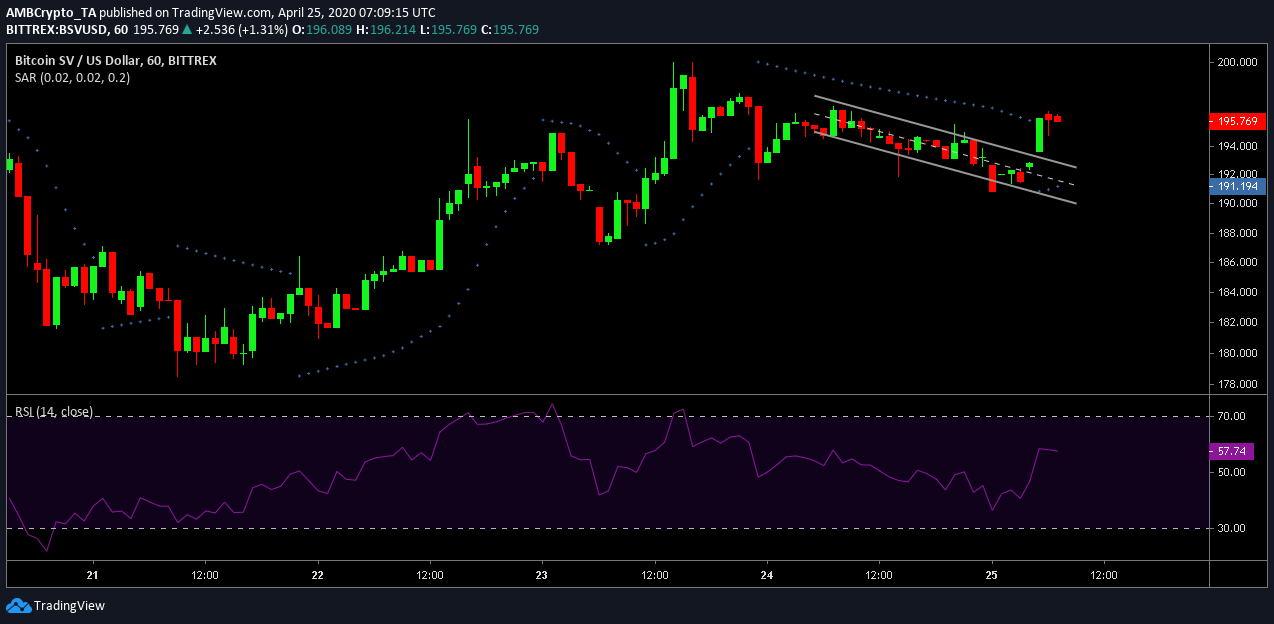
Bitcoin SV was one of the crypto-assets to not take full advantage of the crypto-market’s latest surge. It was unable to breach its resistance at $200 and at press time, continued to trade at a valuation of $195. However, over the past 24-hours, the 6th largest asset did break away from a descending channel, following which, it could possibly attain a bullish rally.
Bitcoin SV’s market cap, at press time, remained around $3.6 billion, with a 24-hour trading volume of $1.87 billion.
The Parabolic SAR also indicated a bullish turnaround as the dotted markers were observed to be under the price candles.
Further, the RSI indicated a tussle between the buying and selling pressure in the market. However, the buyers did have the upper hand at the time of writing.
Ethereum Classic [ETC]
Source: ETC/USD on Trading View
Ethereum Classic managed to rally by 2.23 percent over the past 24-hours, as its valuation stretched from $5.62 to $5.76. Its market cap improved to $664 million, but its trading volume over the past day was extremely high. It registered a volume of $1.69 billion, indicating high user activity.
According to the Bollinger Bands, the market will continue to be volatile in the future, with the mouth of the bands diverging on the charts.
The Chaikin Money Flow or CMF evidenced the rise in trading volume and indicated that there were surging capital inflows into the market over the past 12 hours.
Maker [MKR]
Source: MKR/USD on Trading View
Finally, the Maker token continued to attain a neutral narrative on the charts. The 28th ranked coin was unable to breach its resistance at $340; in fact, this was the case over the past week. Its market cap remained around $338 million, with the token recording low trading volume of only $3.5 million, highlighting a lack of activity in the ecosystem.
The Bollinger Bands suggested a stable market going forward as the bands remained parallel to each other.
The Chaikin Money Flow exhibited an in-flow of capital but at press time, the indicator was on a decline, suggesting that capital was starting to evaporate.
The MACD indicated a bearish trend for the token as the signal line was hovering above the blue line, at the time of writing.

