Analysis
EOS, Ontology, DigiByte Price Analysis: 06 December
Many large-cap altcoins followed Bitcoin’s lead in the market to a certain extent. However, EOS and DigiByte dropped under a level of support and the subsequent pullback saw the same level retested as resistance. In fact, their indicators pointed towards the likelihood of a downside on the charts. Finally, Ontology formed a triangle pattern that could see it resume its previous uptrend, yet a dip to $0.51 might occur before a move towards the $0.57-resistance level.
EOS

Source: EOS/USDT on TradingView
EOS was trading within a descending channel and appeared to retest the $3-level as resistance after a candle closed at $2.85 around 36 hours previously.
The flip of the support to resistance was accompanied by the RSI retesting the neutral 50-zone as resistance, indicative of a downtrend in progress.
The next level of support lay at $2.72, and the lower boundary of the channel can also act as support if EOS were to slip further south.
Ontology [ONT]

Source: ONT/USDT on TradingView
The descending triangle pattern was still in play. It is a trend continuation pattern and ONT can be expected to break out to the upside. However, a stop-loss hunt to the downside might also transpire, with a dip as low as $0.51 before a reversal.
A close below $0.5 would suggest that the bears were gathering strength and further downside would invalidate the triangle setup completely, while a surge past $0.55 backed by strong volume would suggest that $0.57 could be flipped to support shortly.
At the time of writing, the MACD was about to form a bullish crossover, but under zero. Ergo, this was a weak buy signal. The trading volume has been low, and a breakout backed by strong volume would be confirmation.
DigiByte [DGB]
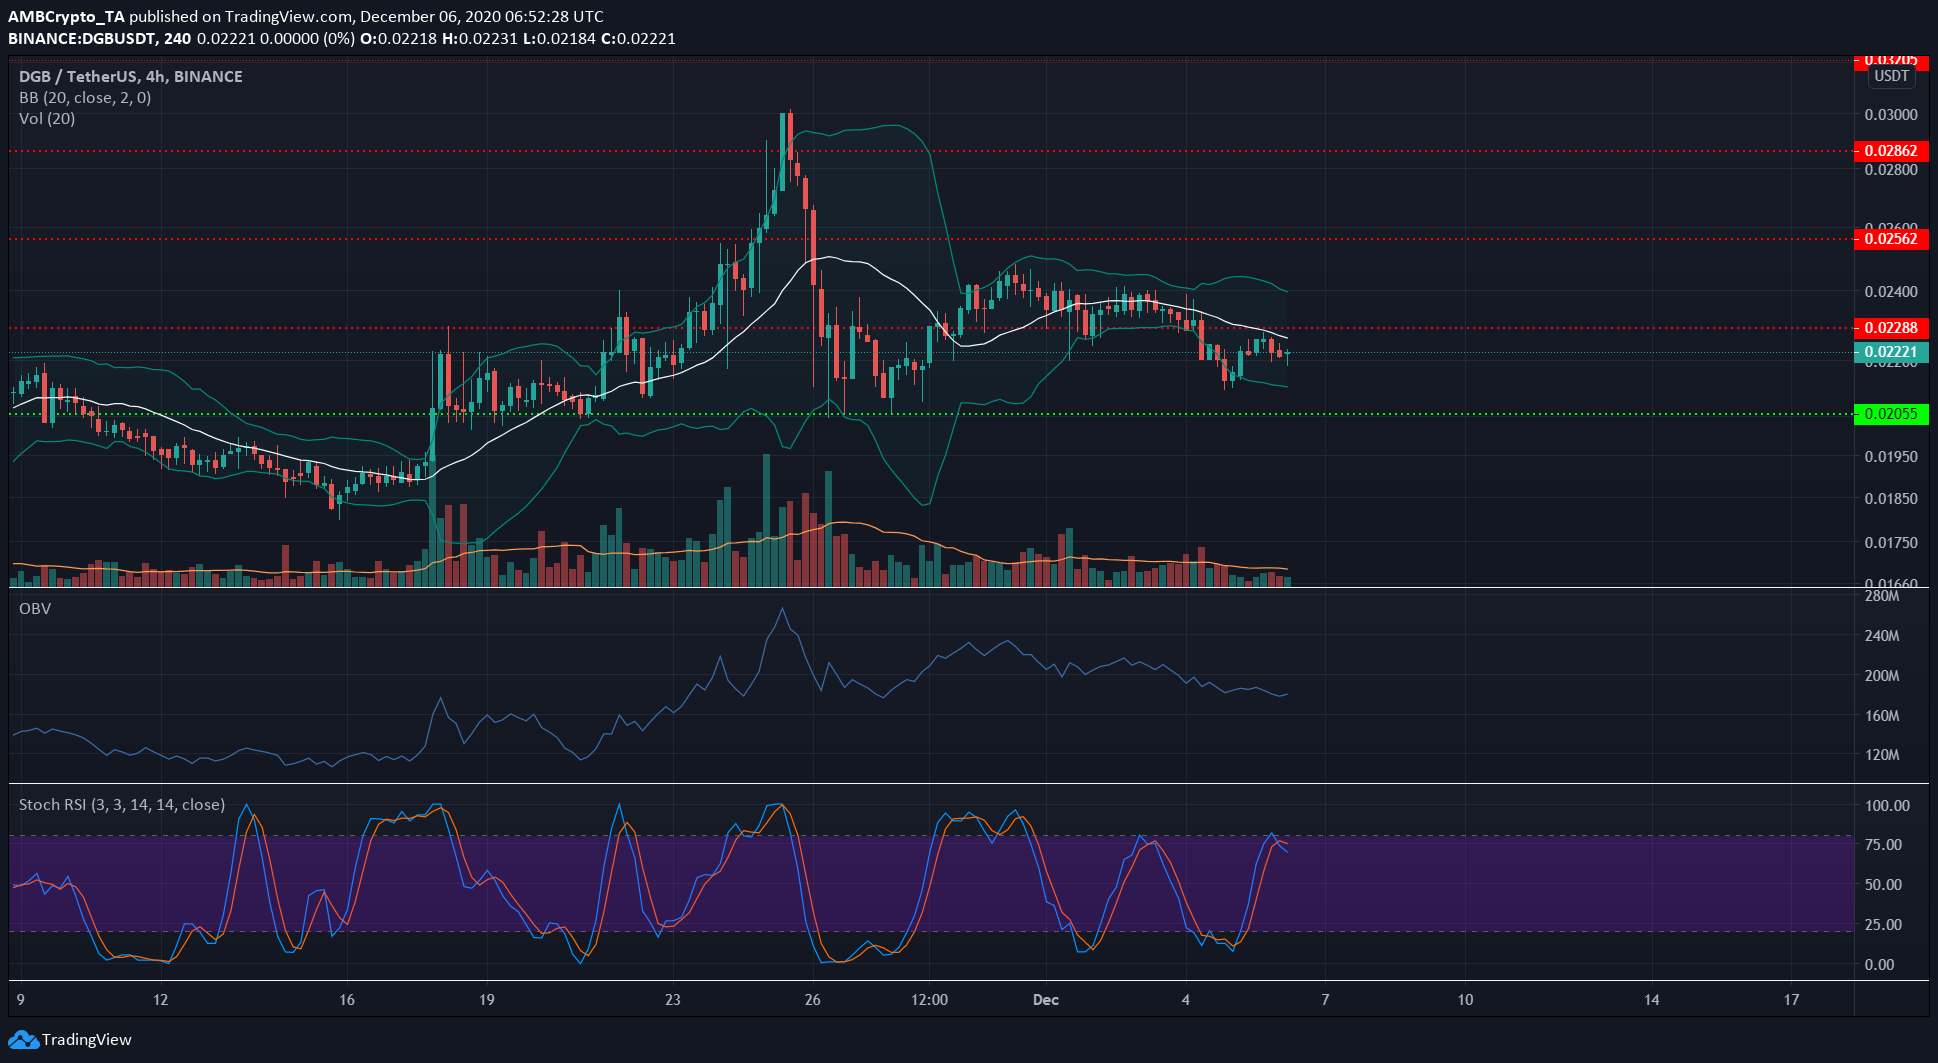
Source: DGB/USDT on TradingView
DGB retested the level of former support as resistance and confirmed that the level at $0.022 was flipped to resistance.
The OBV was on a downtrend to signify falling buying volume. The Bollinger Bands had tightened around the price for a few hours, but the move under the $0.022-support level saw the bands widen, pointing to a southbound break. At the time of writing, the 20 SMA (white) was acting as resistance too.
The Stochastic RSI was heading lower as well. Taken together, it was likely that DGB would be heading towards the support at $0.02.