Analysis
Dogecoin, Ethereum, Monero Price Analysis; 10 June

The collective market cap of the coins has been consolidating below $280 billion as Bitcoin’s dominance declined to 64.7%. After a minor surge of 0.77% over the last 24 hours, Bitcoin’s value was $9,770; altcoins however posted small surges as well.

Source: Coin Stats
Dogecoin [DOGE]:
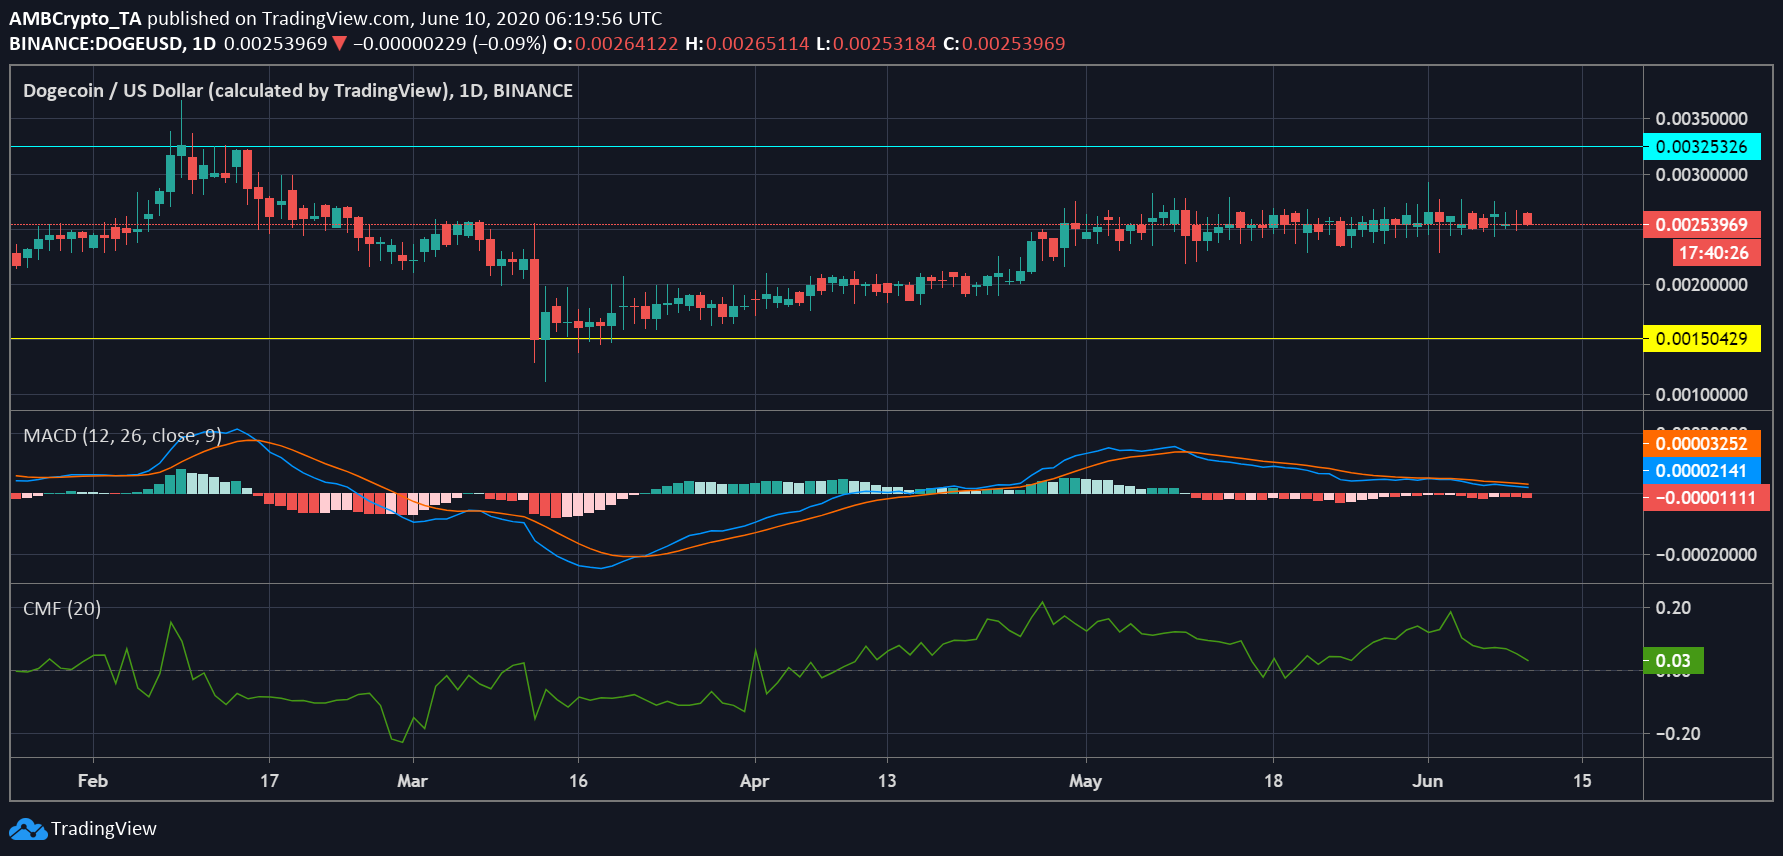
The 33rd largest coin, Dogecoin as per CoinMarketCap’s list has been enjoying its price action lately. It posted a rally at the beginning of the year. At press time, DOGE was valued at $0.0025 after surging by 0.69% over the last 24-hours. It registered a market cap of $320 million and a 24-hour trading volume of $173 million.

Source: DOGE/USD on TradingView
Resistance: $0.0032
Support: $0.0015
MACD: MACD was below the signal line depicting a bearish phase for the coin.
Chaikin Money Flow: CMF was in bullish territory, but it appeared to have been moving close to the bearish region which could indicate outflow of money from the coin.
Ethereum [ETH]:
With the nearing of the major transition for Ethereum ecosystem, the development activity witnessed an uptick. The second-largest cryptocurrency was up by 0.58% which drove its price to $244.8. At press time, ETH recorded a market cap of $27.24 billion and a 24-hour trading volume of $ $7.58 billion.
Source: ETH/USD on TradingView
Resistance: $285.9
Support: $110.2
Parabolic SAR: The dotted markers were below price candles depicting a bullish phase for the coin.
Awesome Oscillator: The red closing bars of AO, however, aligned with the bears.
Monero [XMR]:
Despite a consistent uptrend, this privacy coin has failed to post any significant breakout to the upside. The sixteenth-largest cryptocurrency, XMR was priced at $67.99 after a minor surge of 0.10% over the past day. At press time, its market cap was $1.196 billion, recording a trading volume of $53.5 million over the last 24-hour.
Source; XMR/USD on TradingView
Resistance: $95.36
Support: $32.29
Klinger Oscillator: KO was below the signal line which was indicative of a bearish trend.
Relative Strength Index: RSI was above 50-median line, which indicated buying pressure among the investors.

