Chainlink long-term Price Analysis: 23 July

Disclaimer: The following article attempts to analyze the evolving trend in the long-term Chainlink market and its impact on LINK’s price
The unwillingness of the market’s ninth-largest cryptocurrency, Chainlink, to align with Bitcoin’s price trend has made it one of the industry’s best-grossing assets. While the market rejoiced in the return of little volatility in the BTC market, LINK’s market has been witnessing daily growth.
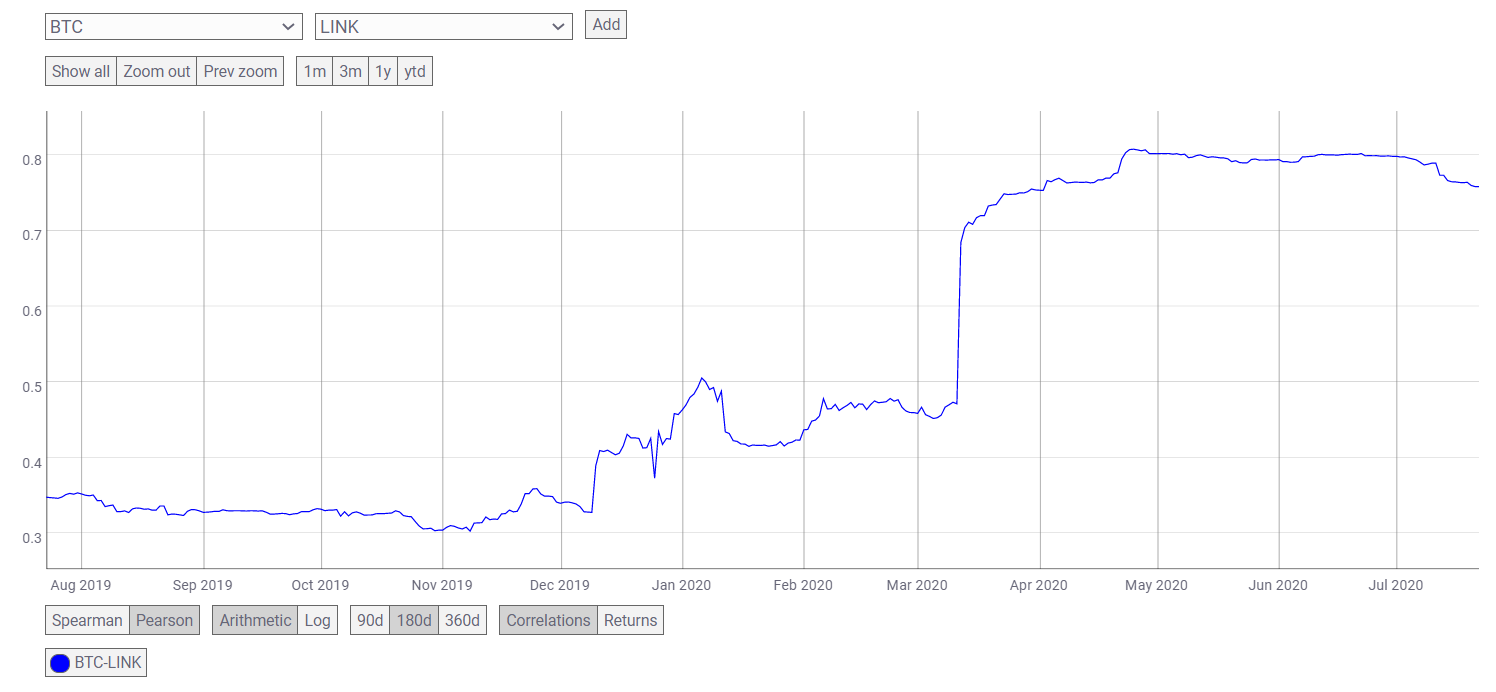
Since the beginning of July, LINK has managed to rake in gains of 63%, with its price escalating from $4.67 to $7.84 within just 22 days. In fact, the correlation between the two crypto-assets was sloping downwards, reaching 0.7586 at the time of writing as LINK was being traded at $7.8412.

Source: CoinMetrics
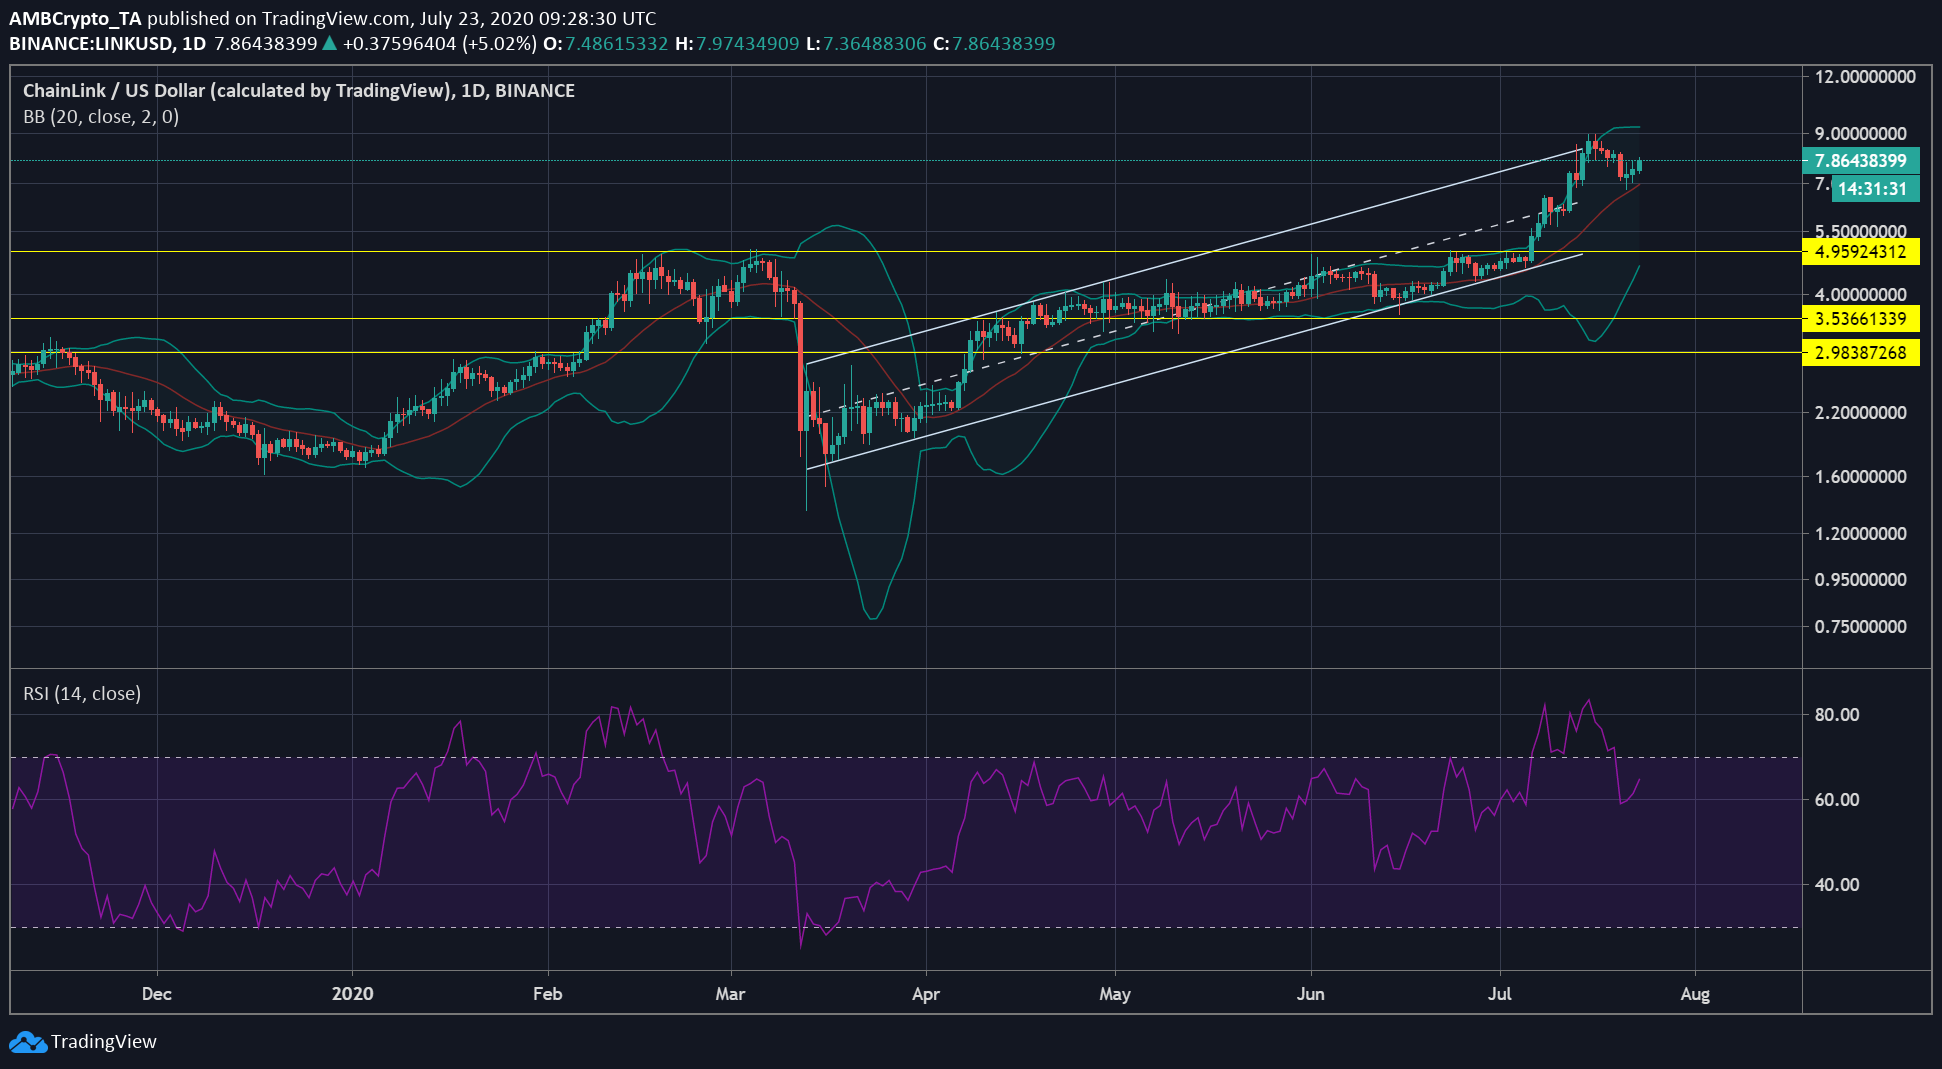
The daily chart for LINK indicated that the price of the digital asset has been sloping upwards as it formed a part of an ascending channel. As the price marked higher highs and higher lows, the crypto-asset moved along the parallel line, while also noting an increase in volatility towards the end of June.
As July commenced, the price of LINK had already gained by 85% since April. With LINK’s price registering even more growth, the ascending channel suggested that a price swing may take root in the market soon.

Source: LINK/USD on TradingView
At the time of writing, the market was in a bullish phase due to sudden upwards volatility, a development highlighted by the Bollinger Bands too. The vast divergence indicated an increase in volatility in the LINK market, one that may continue as the bands remained far apart. The signal line had taken the spot below the price bars, underlining a strong upward rising trend. However, as the day progressed, the signal line was closing in the gap and may cross over the price candles.
Further, the Relative Strength Index also indicated that LINK had been in the overbought zone from 6 July to 19 July and had entered the equilibrium zone after. However, the digital asset was once again moving towards the overbought zone, suggesting high buying pressure in the market.

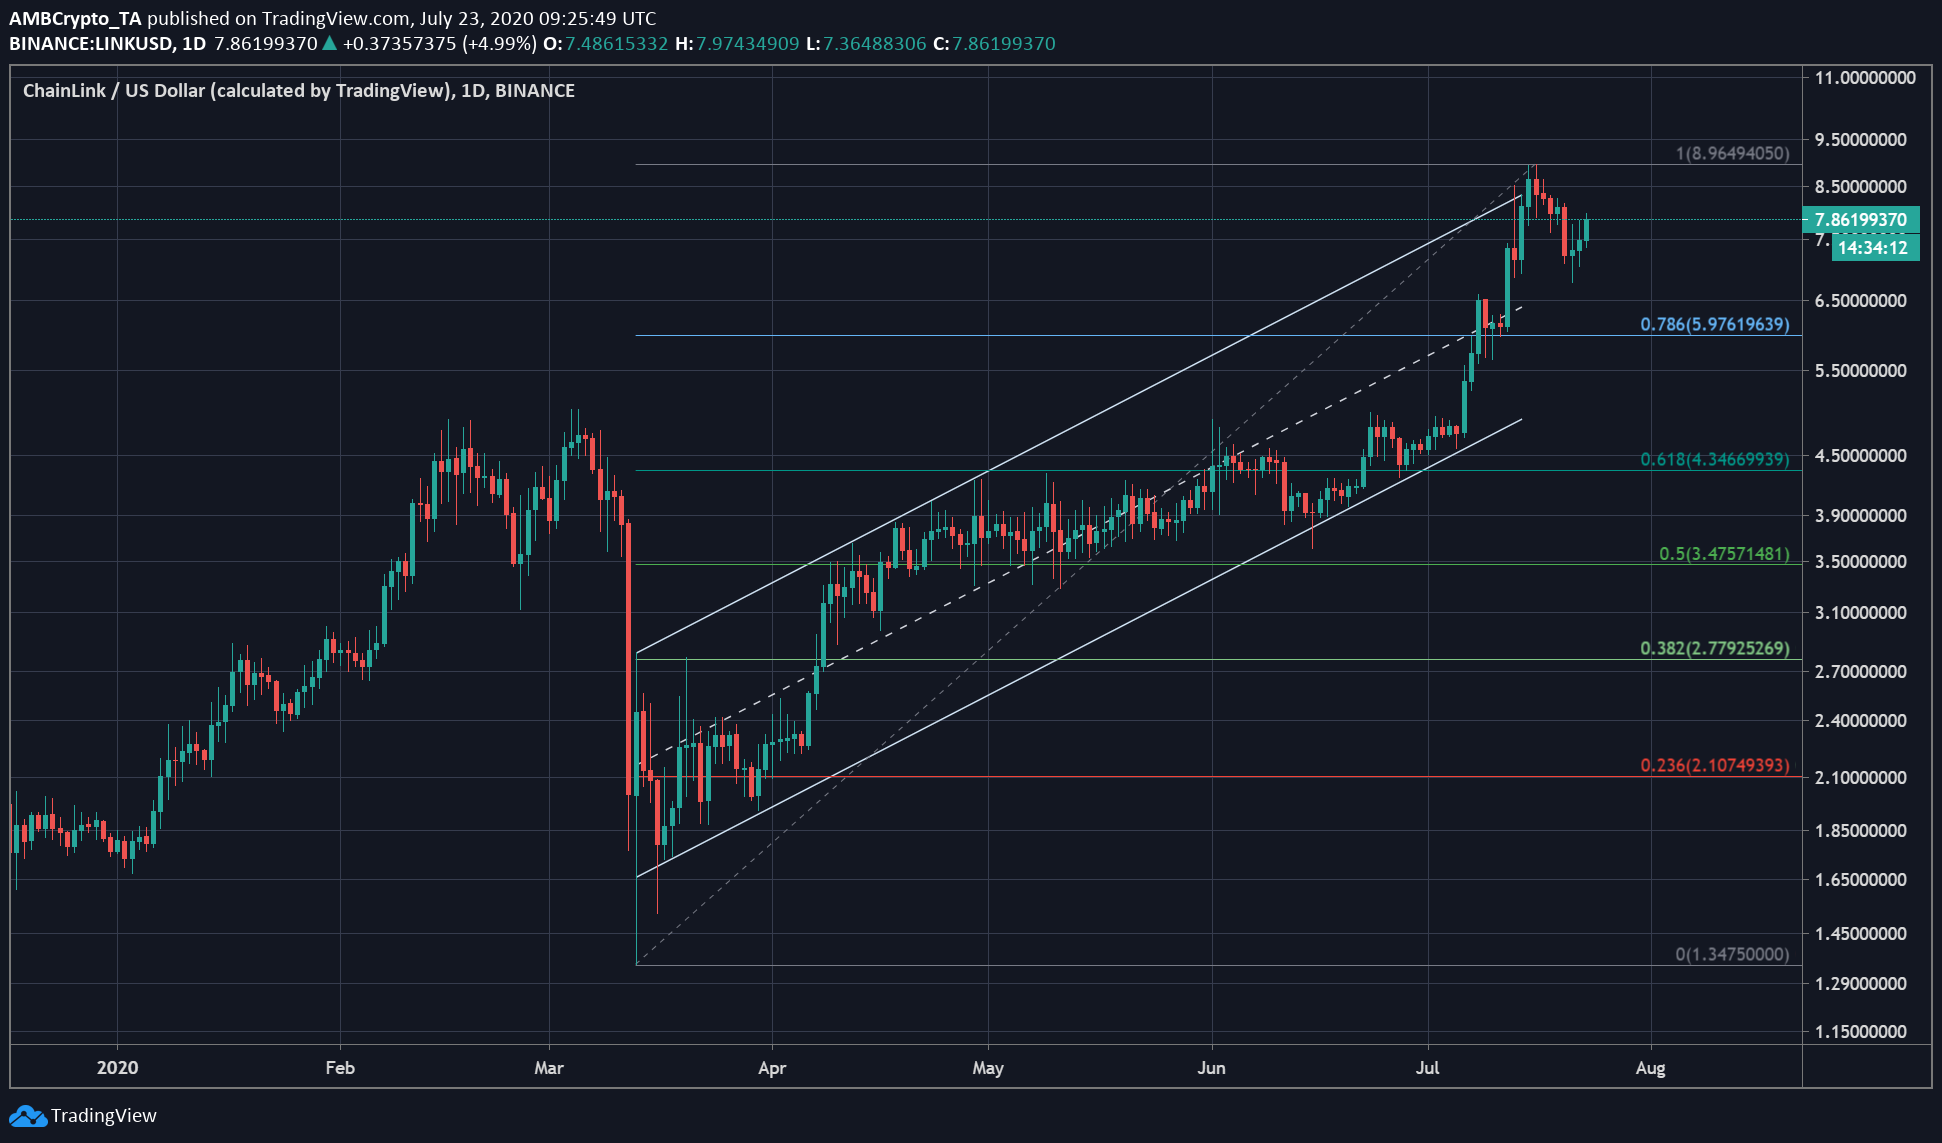
Source: LINK/USD on TradingView
Ergo, the immediate target, if the price of LINK falls, is $5.976, which would be a big slip. The coin’s resistance was as high as $8.96, however, no support has been offered between $8.96 and $5.97. If the price failed to hold on to $5.97, the value of LINK may depreciate to $4.34 as the next strong support level was etched here.
With LINK trying to make its way north on the charts, a bearish pressure was also taking shape in the market.
