
Bitcoin’s price has been on a recovery run since its fall on the price charts at the start of the month. However, for altcoins like Chainlink, Bitcoin’s sentiment did not seem to have a lot of effect on the cryptocurrency’s price action. Since the start of September, the cryptocurrency’s price has largely been on a downward spiral. However, over the coming week, there is the slight possibility of an uptrend starting if a breakout happens.
At press time, Chainlink was being traded at $10.81, having registered a market cap of $3.7 billion. Over the past 24-hours, the cryptocurrency saw its price appreciate by a marginal 0.29 percent after noting a 24-hour trading volume of $1.4 billion.
Chainlink 1-day chart
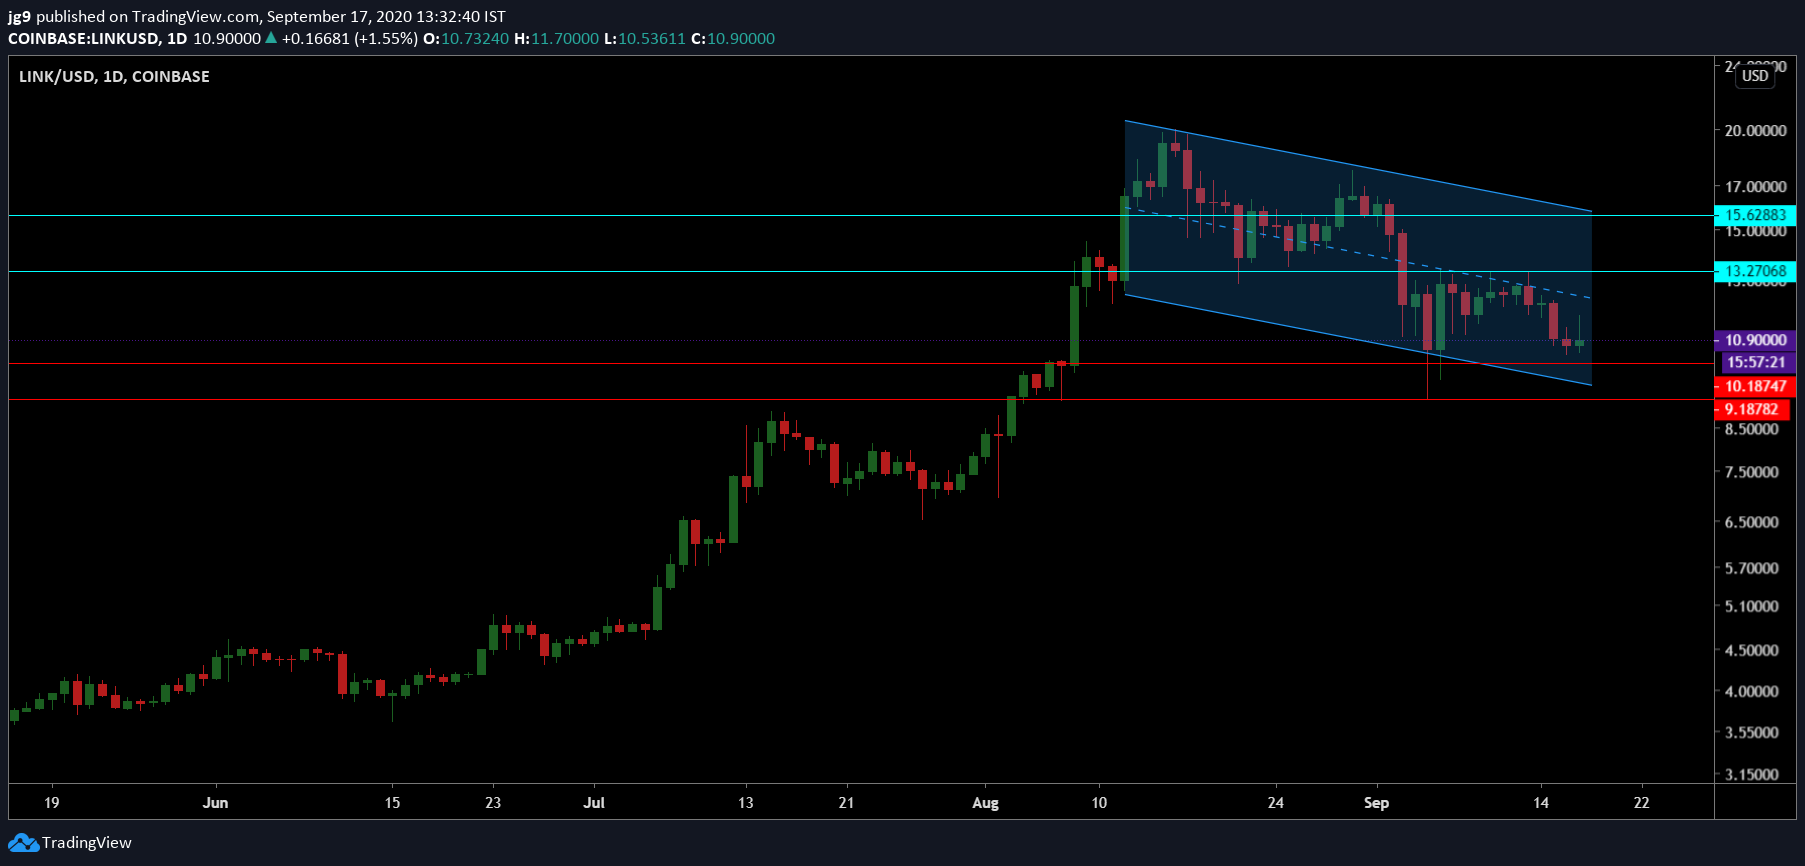
Source: LINK/USD, TradingView
According to LINK’s daily chart, the price has been confined to a descending channel formation since the second week of August. The price fall on the back of Bitcoin’s September woes seemed to have been part of the larger price pattern Chainlink finds itself in now. The coin’s price was very close to testing the support at $10.18 and if the support holds, the coin may have enough momentum to try and head towards the resistance at $13.2.
If the price were to break out of the formation, the first resistance is likely to be its primary target. However, given the price action over the past few weeks, this scenario remains fairly unlikely. If the price were to remain within the formation and see a further drop, Chainlink may end up needing the help of its second support at $9.1.
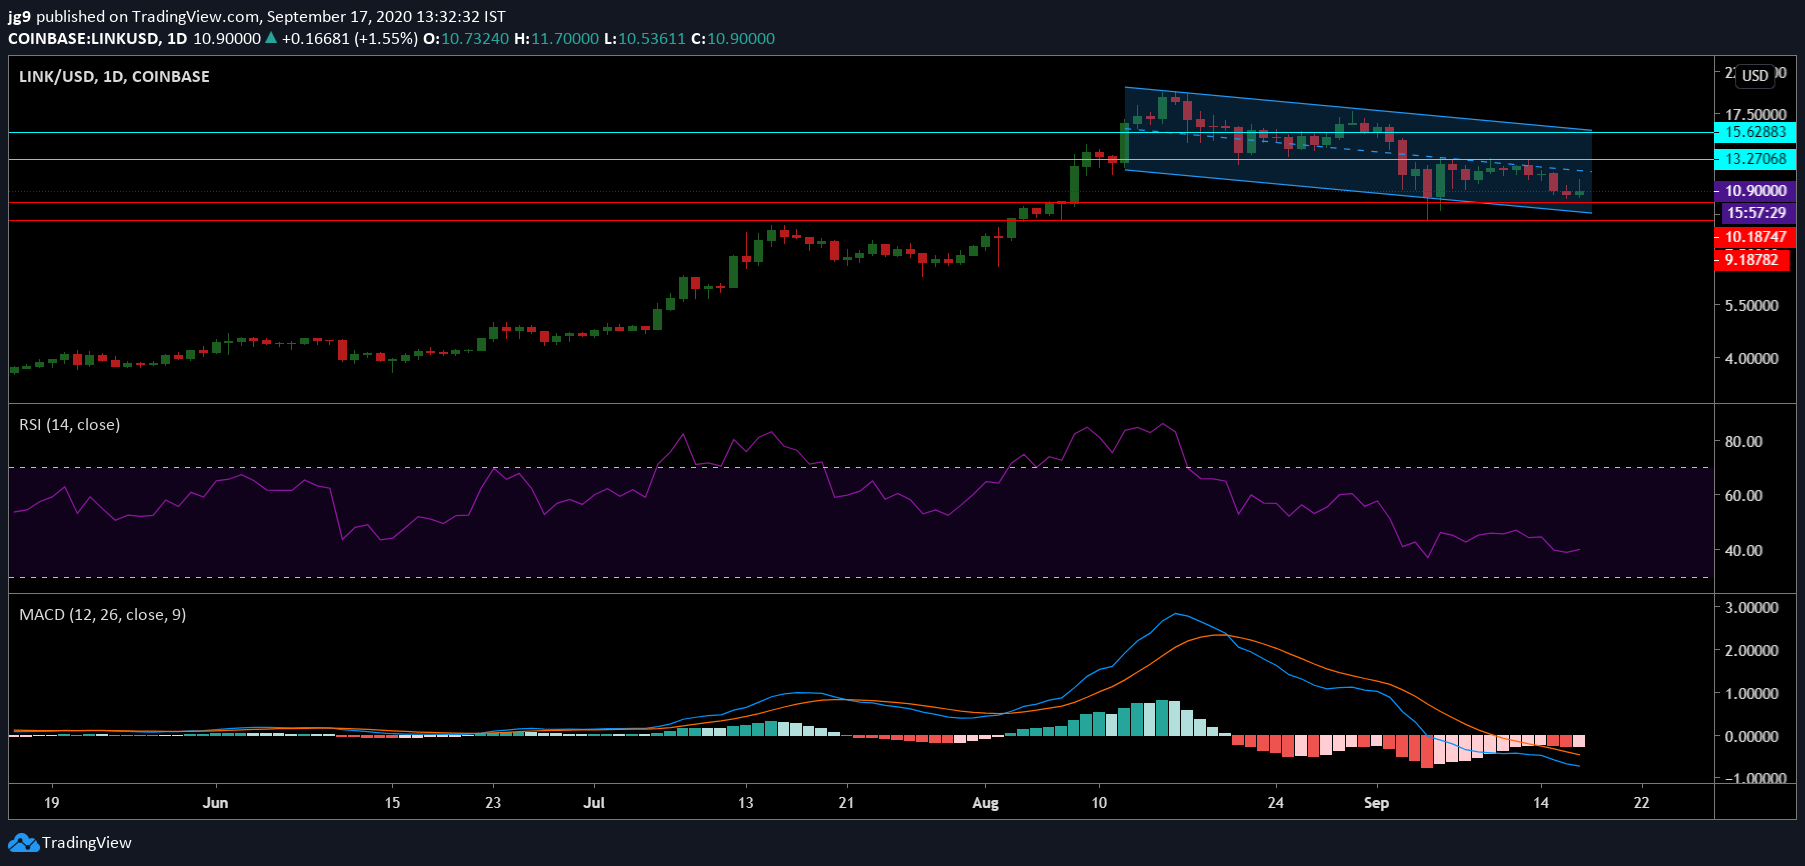
Source: LINK/USD, TradingView
The technical indicators for Chainlink concurred with the possibility of the cryptocurrency’s price dipping even further on the charts. The RSI indicator was also moving slowly south of the neutral zone, a sign of growing sell-pressure. The MACD indicator underwent a bearish crossover and didn’t seem like it was going to see a reversal anytime soon.
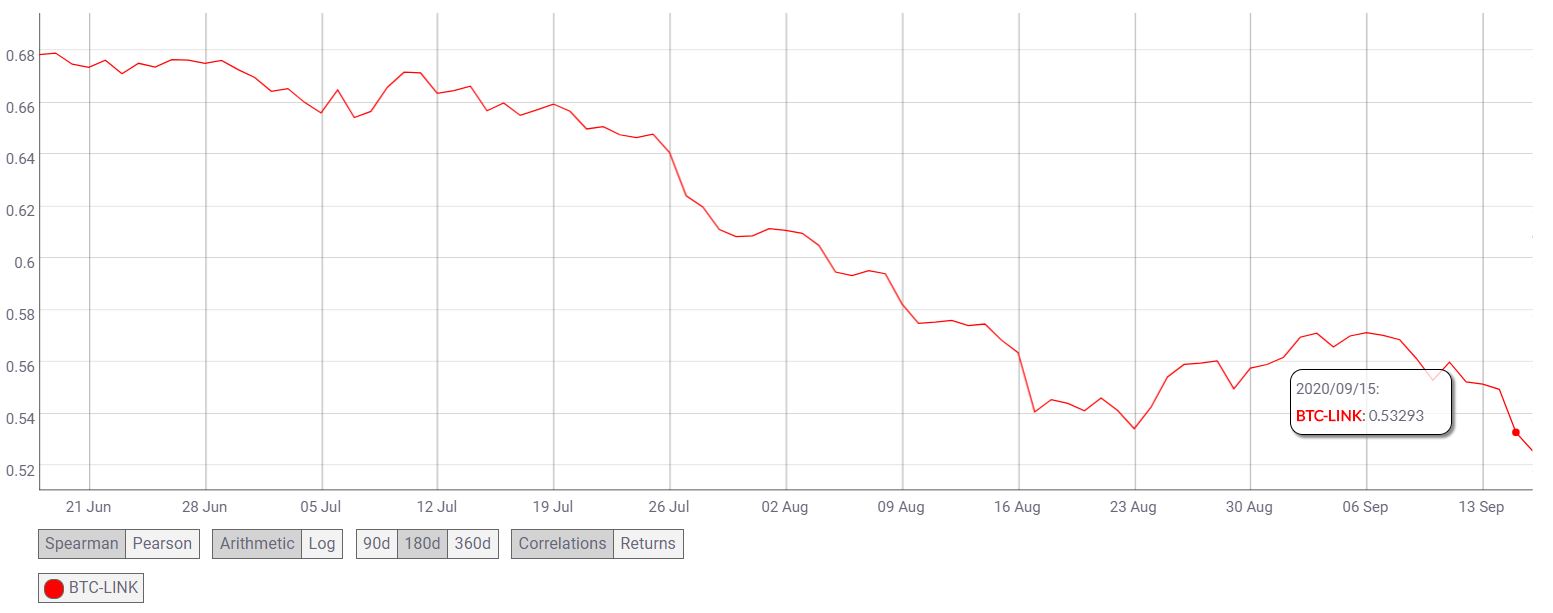
Source: CoinMetrics
Over the past three months, Chainlink’s correlation with Bitcoin has fallen substantially According to data provided by CoinMetrics, BTC-LINK correlation fell from 0.67 to 0.652.
Conclusion
Chainlink’s price has been stuck in a descending channel formation for close to two months now and at press time, the coin seemed to lack the bullish momentum to break out of the formation and head towards its immediate point of resistance. As per the indicators and its previous price action, it is likely that the coin will remain in the descending channel formation in the coming week and may even dip towards its second point of support at $9.1.