
Disclaimer: The findings of the following analysis attempt to evaluate the evolving price trends in the Chainlink’s market and its impact
At the time of writing, the larger crypto-market seemed to be on its way down. In fact, the price of Bitcoin went down by 1.72%, with the world’s largest cryptocurrency depreciating from $9,198.56 to $9,040.25 within three hours. The altcoin market also appeared to be taking a hit, with Ethereum down by 2.88% and XRP down by 3.68%.
On the contrary, Chainlink, the market’s eighth-largest coin, wasn’t noting any losses on its chart, at the time of writing.
Unlike other alts, LINK was gaining by 1.58% over an hour, a sign of the fact that despite becoming a major altcoin, it is not significantly being affected by the Bitcoin market. While Bitcoin was returning 26% to its investors in YTD, LINK was returning 382% in YTD. In fact, the correlation chart provided by CoinMetrics suggested that even though the correlation between the two assets was high at 0.76, it has been noting a dip recently.
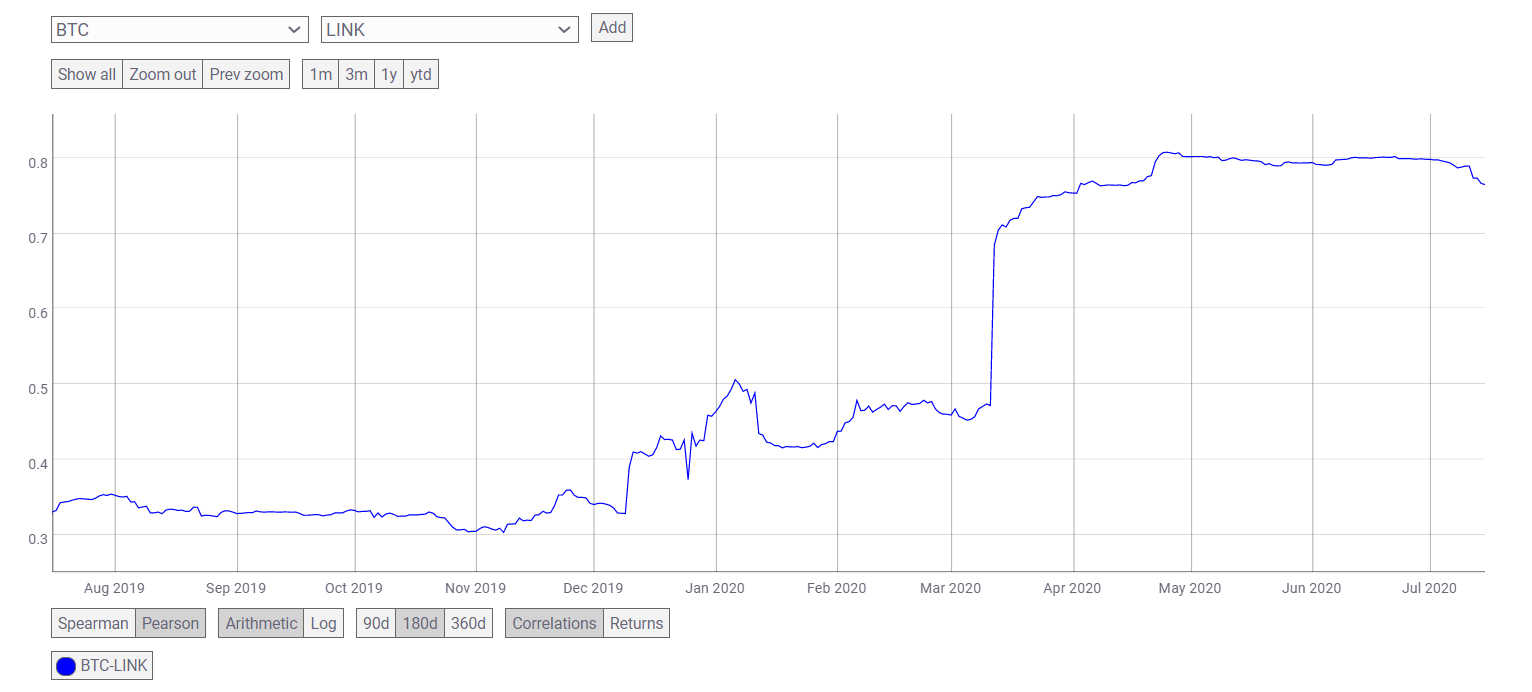
Source: CoinMetrics
LINK’s price has been recording steady gains since the market crash in March, with the crypto valued at $8.1928, at the time of writing. The market cap of LINK had touched $2.88 billion, while its 24-hour trading volume remained around $1.23 billion.
However, the price of the crypto, while pushing upwards, might just be part of a bearish pattern, with a fall likely in LINK’s near-future.
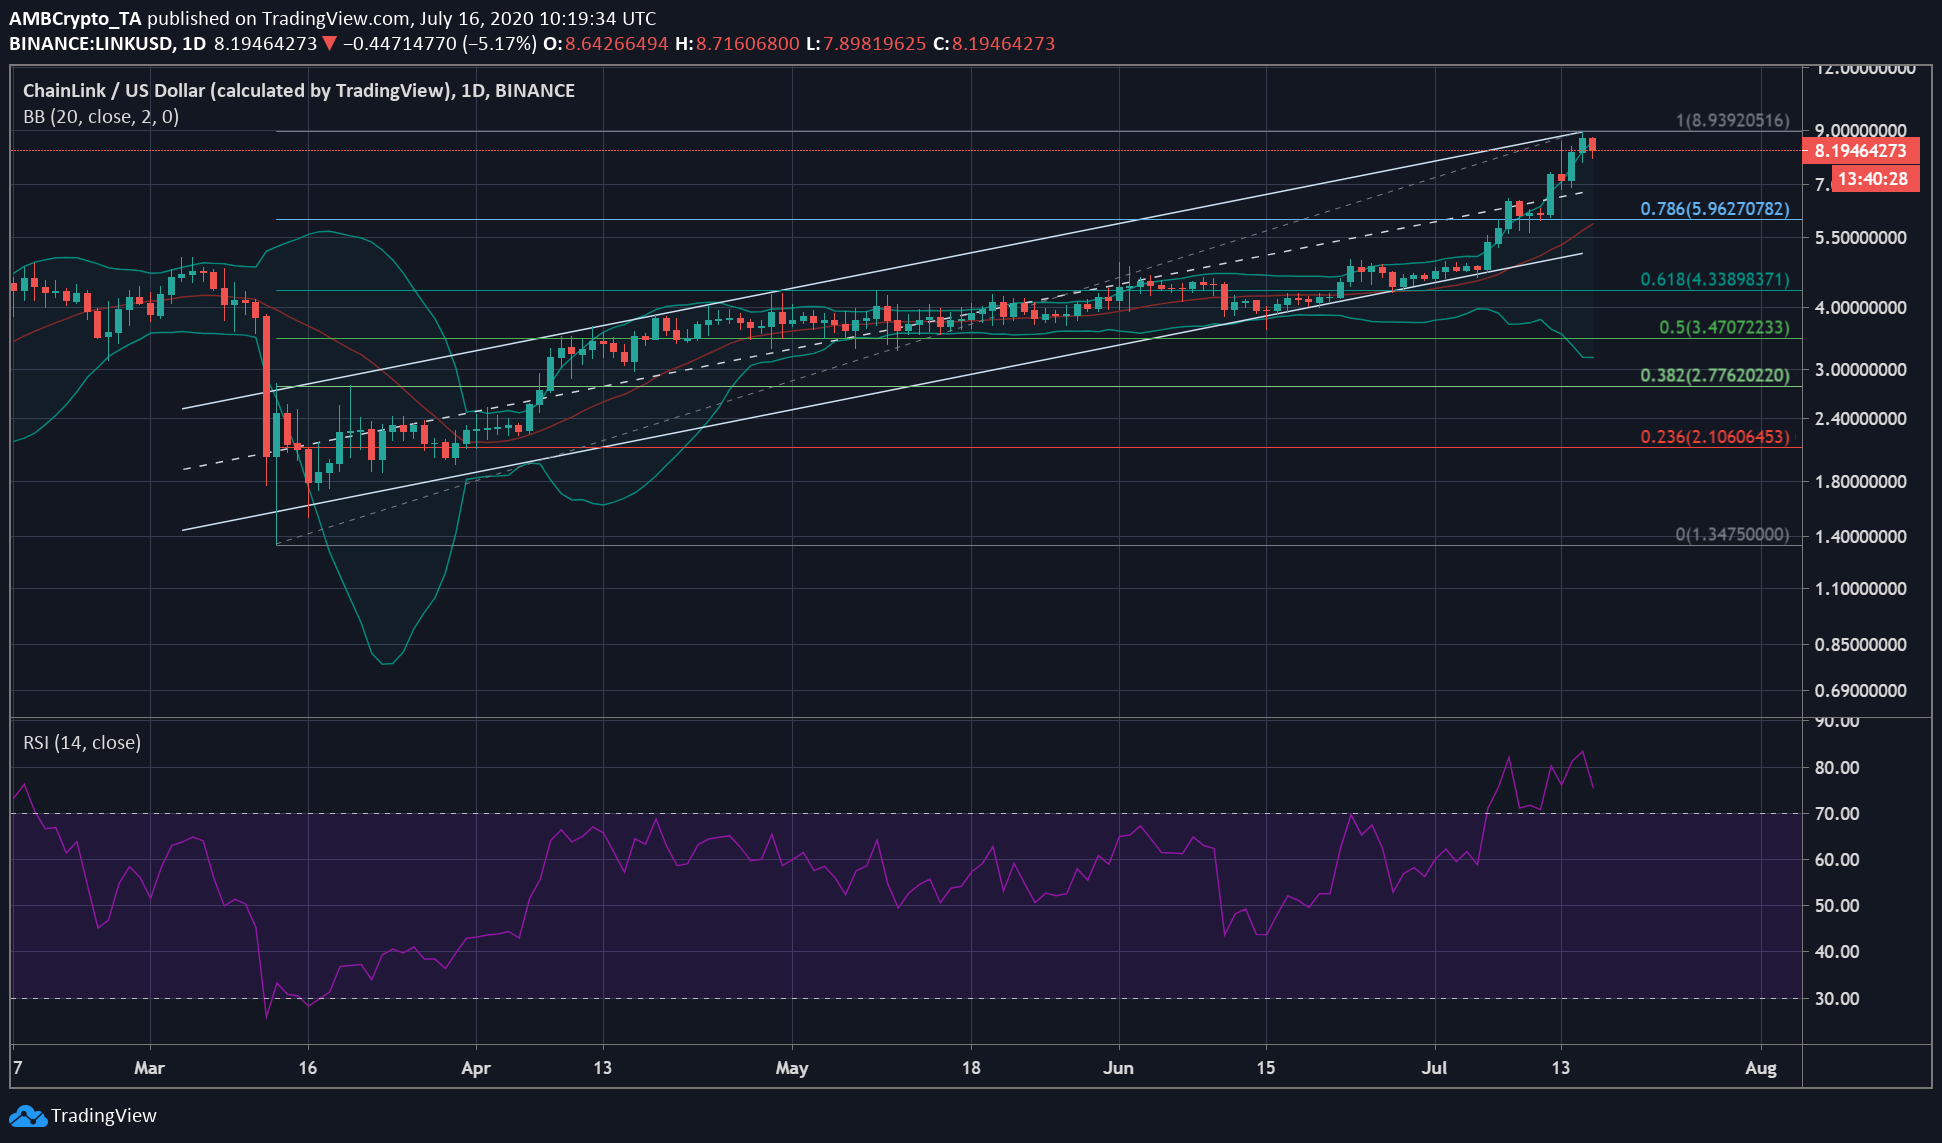
Source: LINK/USD on TradingView
The daily chart for LINK suggested the formation of an ascending channel, with the price action contained between upward sloping parallel lines. The line above the price bars connected the higher highs and the lower bar joined the higher lows. The chart also noted that even though the price had moved gradually upwards since March, there was a sudden boost in price at the beginning of July.
As the price of the cryptocurrency climbed, the market became open to more volatility, something evidenced by the fact that the Bollinger Bands were diverging on the charts.
Further, the signal line was under the candlesticks and pointed to a bullish market. However, the coin had reached the overbought zone, according to the Relative Strength Index. A correction might be incoming for the market soon, with the first support at $5.9, as highlighted by the Fib Retracement tool. However, the point may not be able to provide ample support, and building market pressure could push the price to $4.33 on the charts.
It can be concluded, thus, that the LINK market appeared due for a correction, a development that may put two price points to test – The first being $5.96, and the other one at $4.33.