
Disclaimer: The findings of the following analysis attempt to foresee Chainlink’s price movements until the last week of July
Chainlink was launched only in June 2019. However, a few weeks since its 1-year anniversary, the coin’s price on the charts seems to be unstoppable. LINK’s recent movements have been an extension of the recovery it has been on since the larger crypto-market crashed back on 12 March. At the time of writing, Chainlink’s price was noting a new all-time high for the cryptocurrency.
At press time, Chainlink was being traded at $6.2, with the crypto recording a market cap of $2.1 billion. Over the past 24 hours, LINK’s price also registered a minor dip of 0.5 percent, having noted a 24-hour trading volume of $788 million.
Chainlink 1-day chart
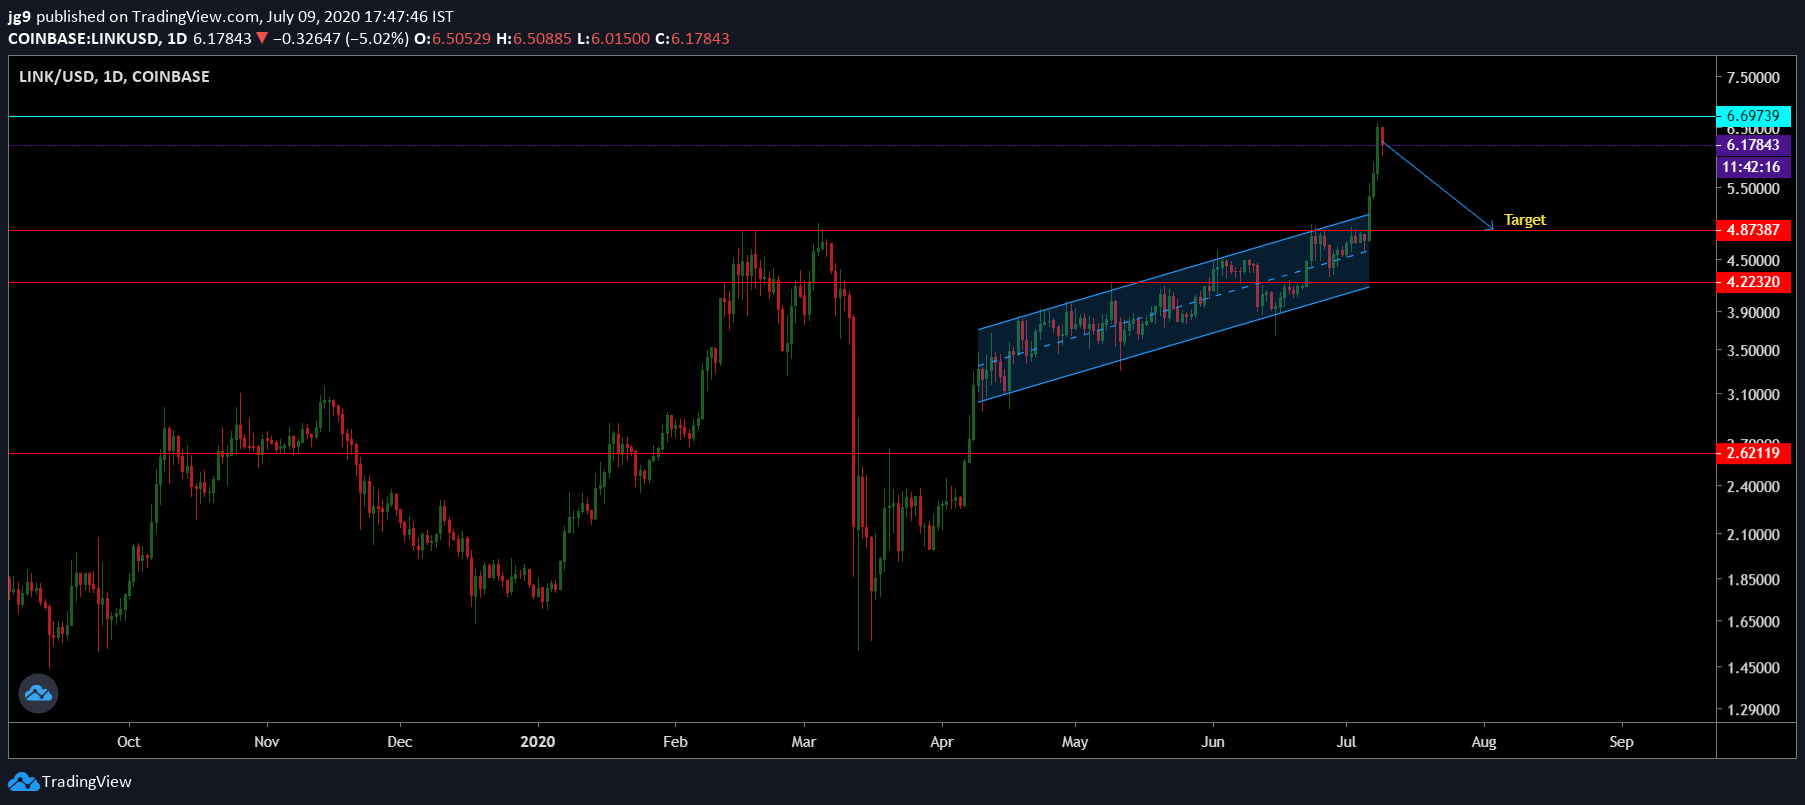
Source: LINK/USD, TradingView
According to Chainlink’s 1-day chart, the price had been in an ascending channel formation since April, with the price candles breaking out of the formation a few days back. Since 6 July, the price has continued to surge, noting an ATH soon after. However, the past 12-hours did see LINK’s price run into some resistance, with the crypto trading at a price point that was below yesterday’s trading price.
At press time, Chainlink’s price was unable to breach the resistance at $6.6. However, since the price was in an ascending channel formation and due to its strong resistance, the price is likely to retrace towards its next support at $4.8. In the unlikely scenario in which all bullish pressure disappears, Chainlink may drop to its early-June levels at around $4.2, another strong support for the coin.
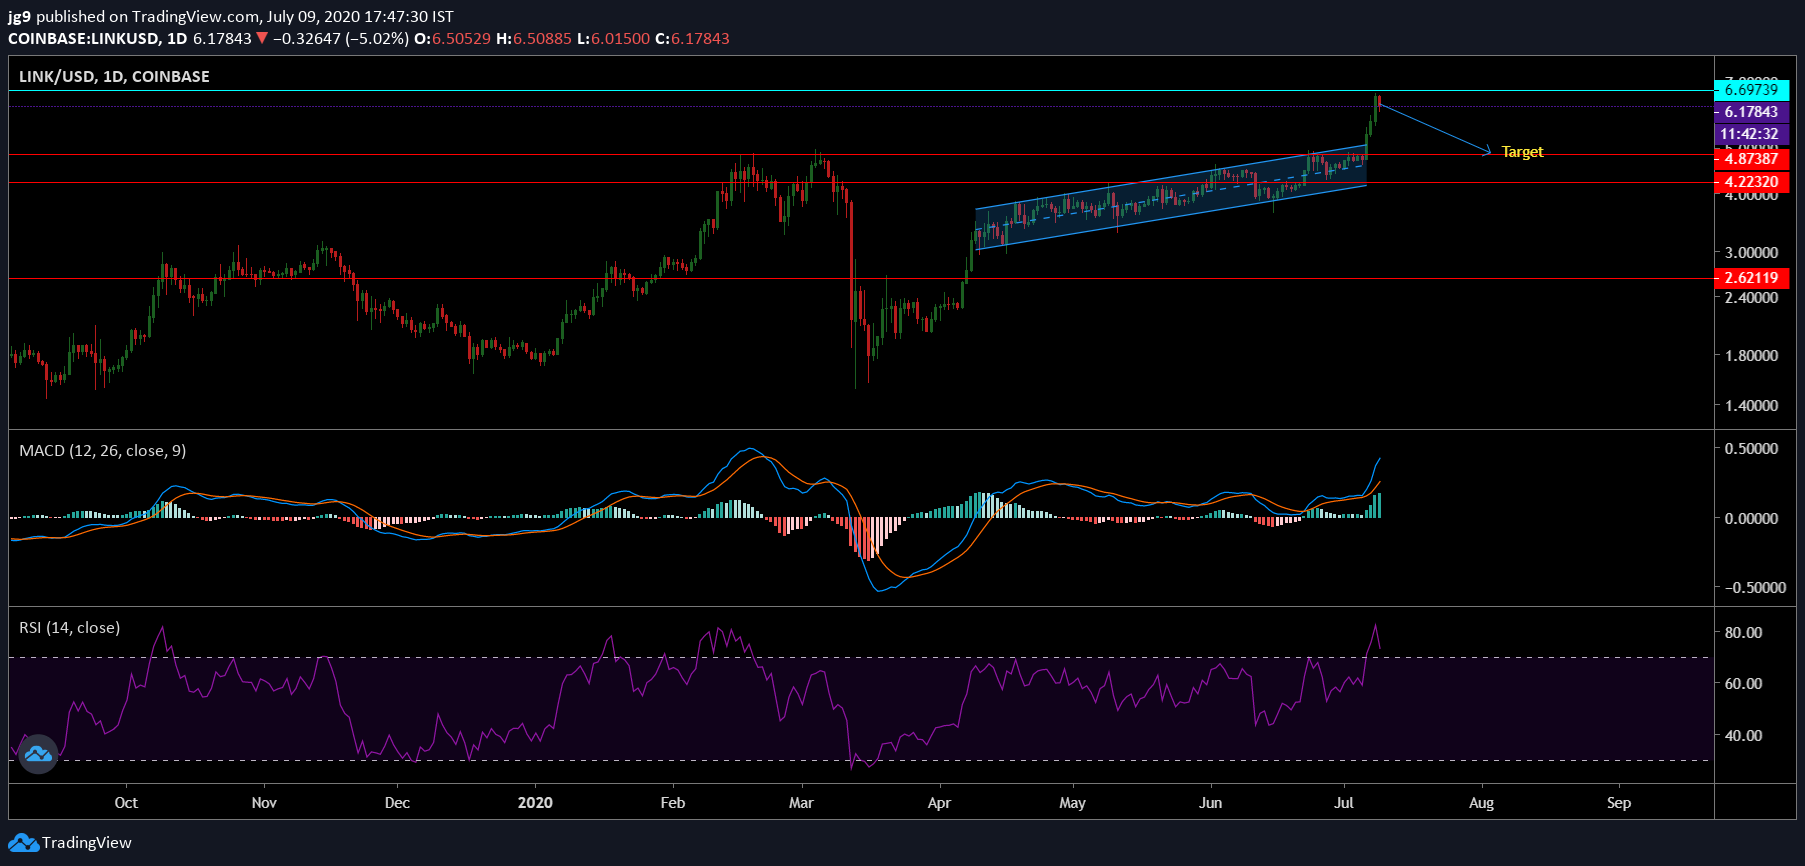
Source: LINK/USD, TradingView
Further, the MACD indicator had recently undergone a bullish crossover, with the MACD line going past the Signal line on the charts. The Relative Strength Indicator, on the other hand, was heading towards the oversold zone after having been in the overbought zone for quite a while, another huge boost for the coin’s trading price.
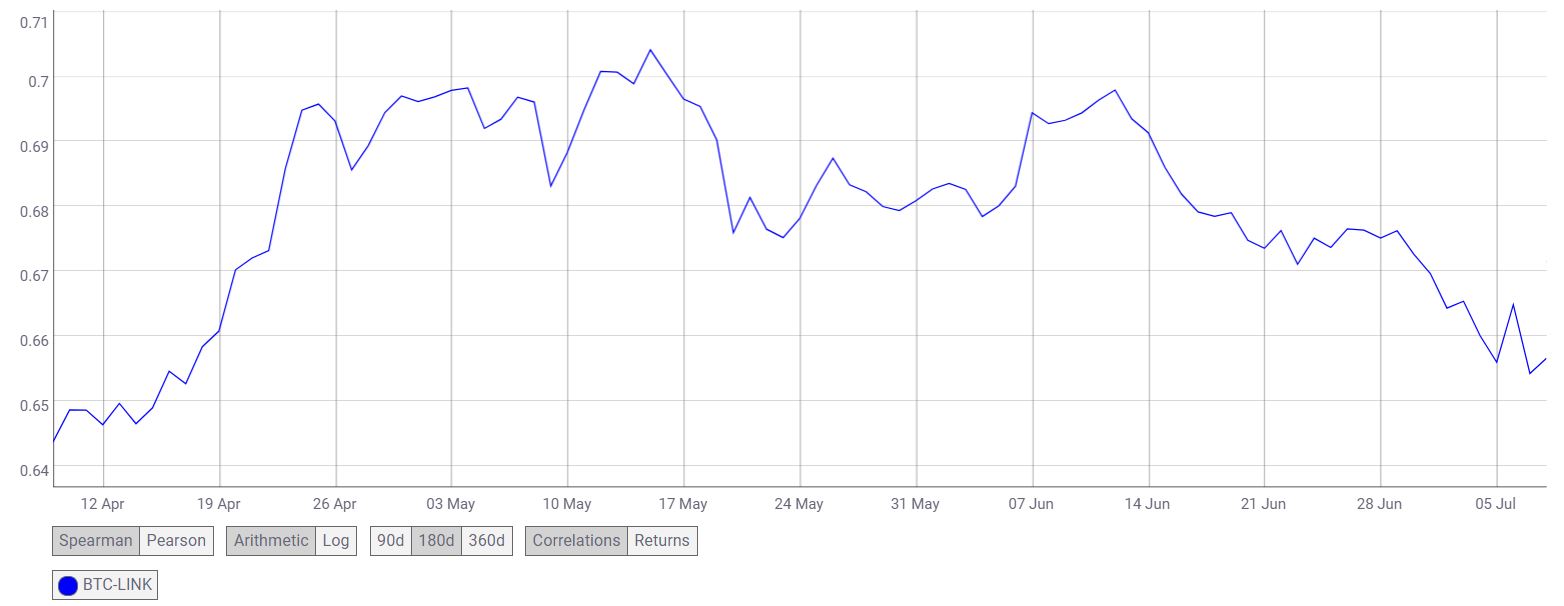
Source: CoinMetrics
Interestingly, Chainlink’s correlation with Bitcoin has fallen over the past 3-months and akin to many other altcoins, the past few days have indicated that for coins like Chainlink, a bull run may be possible, one independent of the king coin.
Conclusion
Chainlink’s price was in an ascending channel formation for over 3 months, following which, an upward price breakout took place. However, the price soon found resistance at around $6.6 after having registered an ATH.
In the coming weeks, if the bulls are unable to carry the price any higher, Chainlink’s price is likely to head towards the support at $4.8 which remains its likely target. However, in the coming days, if the coin’s able to breach the resistance, a short-term surge for the coin cannot be ruled out.