Chainlink long-term Price Analysis: 08 October

October hasn’t really been favorable to the digital assets industry, with many of the market’s assets struggling to keep up with bearish pressure. With Chainlink staying close to its $10-valuation on the charts, many in the community are expecting the cryptocurrency to drop further. In fact, recent analysis suggests that another breakout might take place over the next few days, with price volatility holding steady, at the time of writing.
Chainlink 12-hour chart

Source: LINK/USD on TradingView
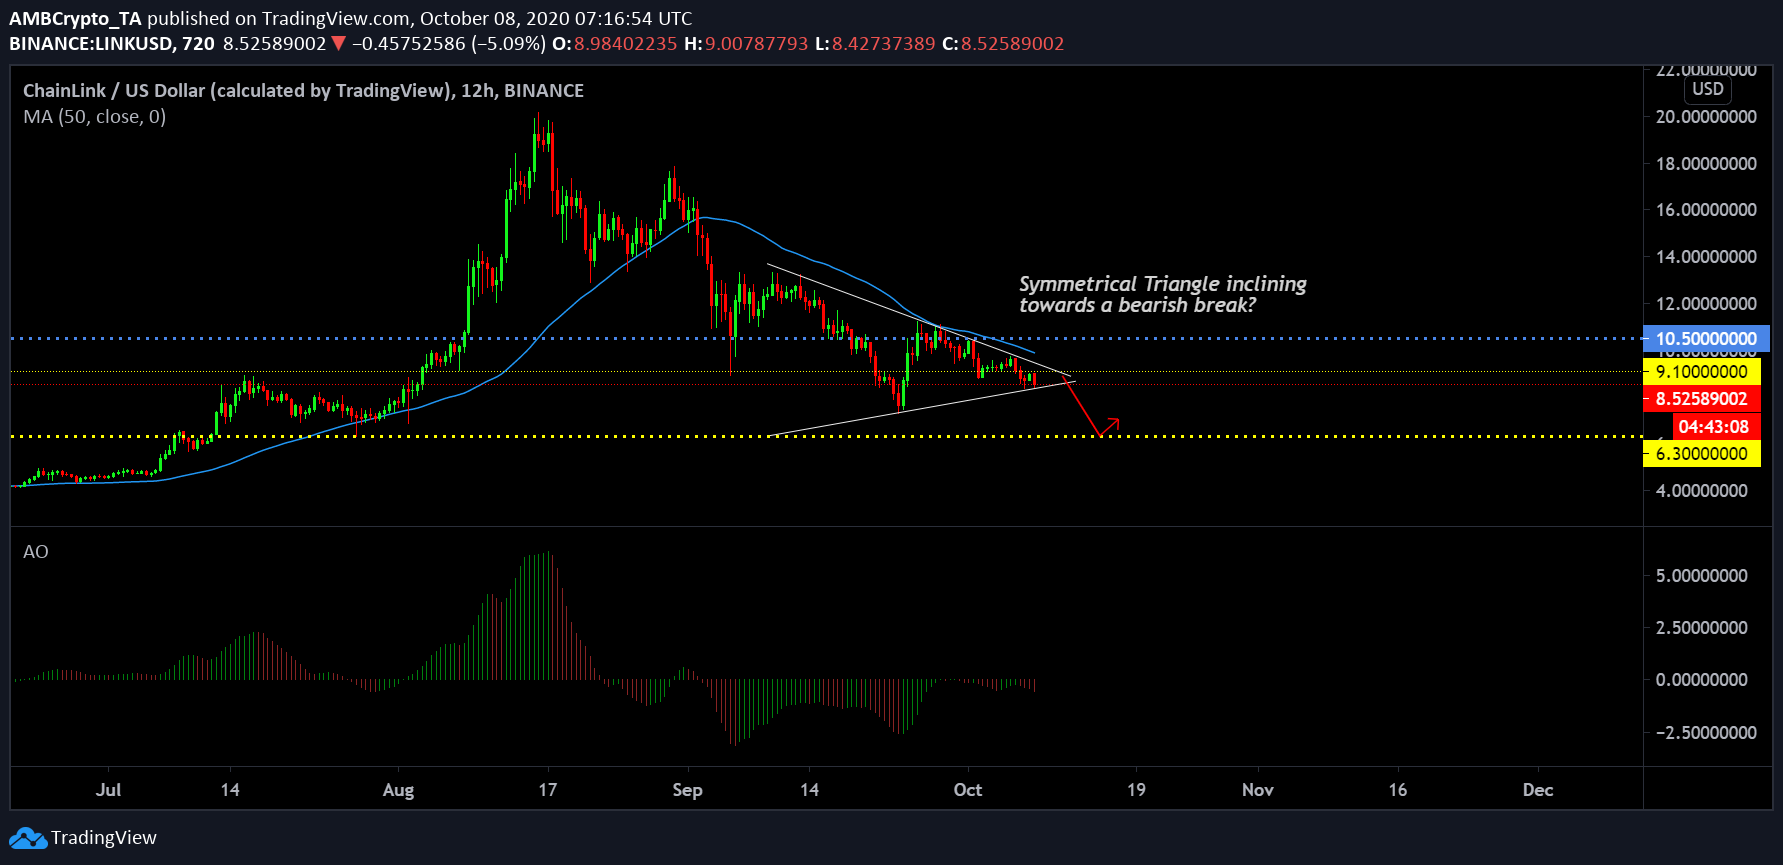
While climbing to $20 on the charts was the highlight for LINK, the crypto-asset did well to avoid significant drops in the months of August and September. However, little by little, the trend has become more bearish. At the time of writing, the price pointed to the formation of a symmetrical triangle which might lead to another breakout over the next week. The price range between $10.50 and $6.30 was an active range in the month of July as well and at press time, the trading range was registering renewed volumes.
While a symmetrical triangle carries both bullish and bearish implications, market indicators seemed to be leaning towards a drop. The 50-Moving Average hasn’t been tested much lately, with the MA thrusting significant selling pressure. The Awesome Oscillator also suggested that the momentum has been pretty neutral over the past week, highly indicative of a reversal at any given time over the next 1-2 weeks.
If the bears take charge, a re-test at the long-term support of $6.30 is possible, but the bottom might be closer than the support itself.
Chainlink’s possible bottom range

Source: LINK/USD on TradingView
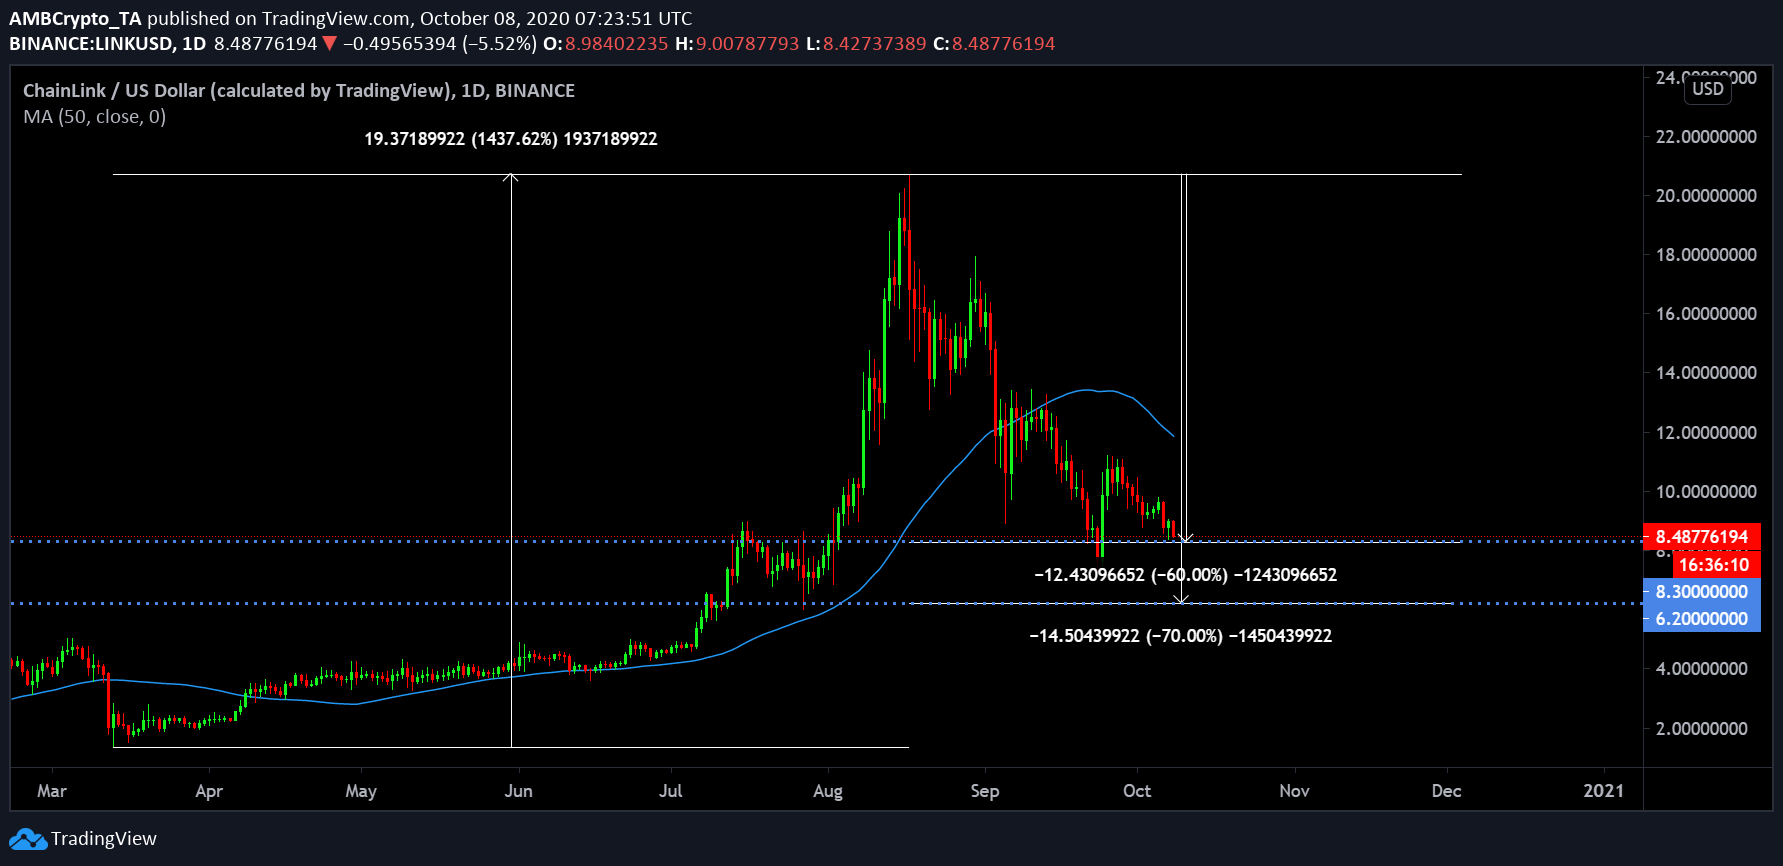
While it is impossible to accurately predict a trend bottom, the market structure suggests that usually, a drop of 60-70% might take place from the top during a highly volatile bearish rally. Now, if Chainlink’s 1437% growth from March is taken as the complete 100% of its bullish rally, a 60% drop from the top at $20.22 is $8.30. While a 70% drop is $6.20, fairly near to $6.30.
Hence, the bottom range between $8.30-$6.20 is a 60-70% drop for Chainlink. While the price might jump from anywhere in between, the bright side suggests that the bearish trend is nearing an end.
However, further collapse below $6.20 will be disastrous and the bottom will be anyone’s guess from thereon.


