Analysis
Chainlink, FTX Token, Crypto.com Coin Price Analysis: 27 September

Chainlink was noting some bullish momentum in its market in the near-term, but it still had an important level of resistance to reclaim to flip its bearish medium-term outlook to bullish. This comes after a recent report suggested that Chainlink had decoupled from Bitcoin.
FTX Token rose past a level of resistance. but the market was indecisive after flipping the level. Crypto.com Coin lost the strong uptrend it was on since March, and established a possible range for its price in the coming weeks.
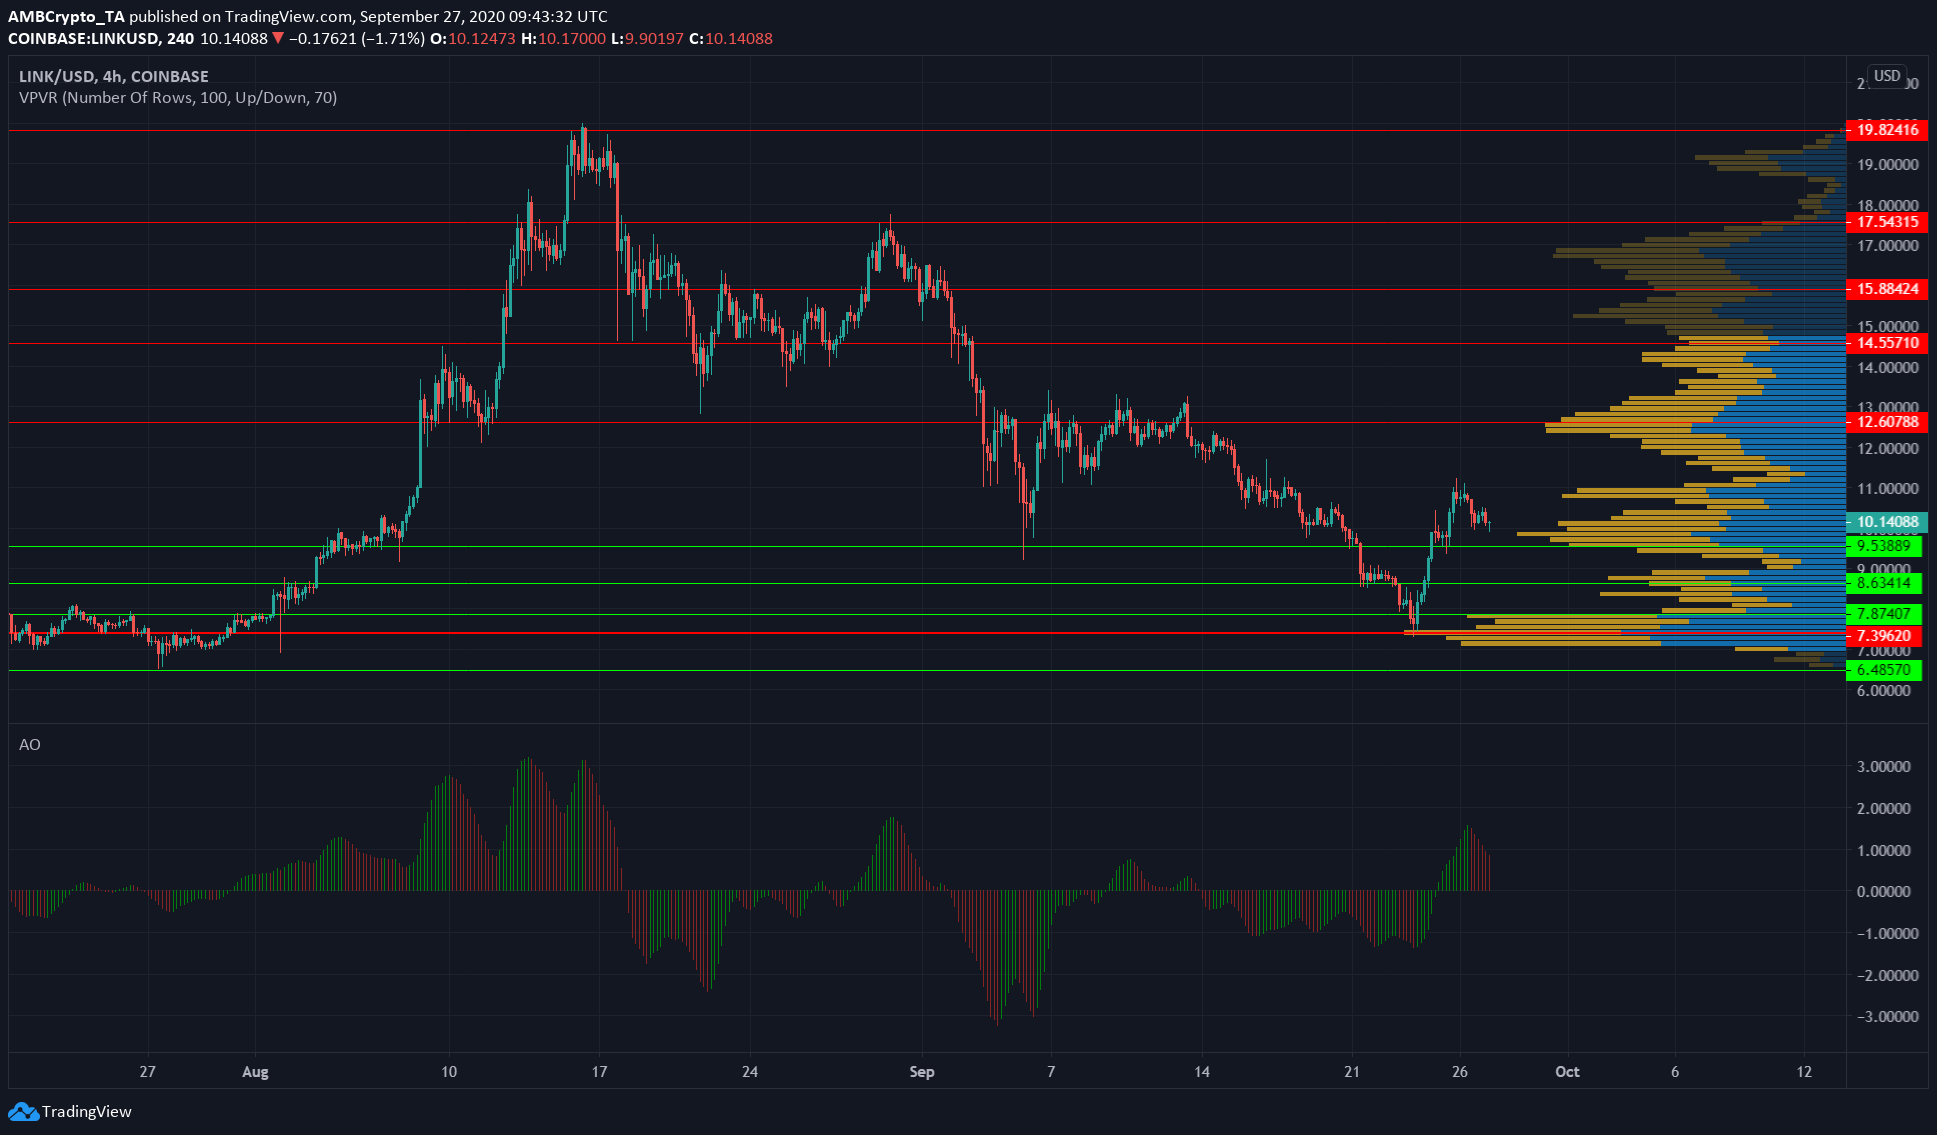
Chainlink [LINK]

Source: LINK/USD on TradingView
As shown by the VPVR, LINK had strong levels of support at $7.4, $8.5, and $9.5, with levels of resistance at $10.5 and $12.5 to the upside.
With the evidence at hand, we can only conclude that LINK bounced off its support at $7.5, in a move that is only a pullback before another drop to $6.5 and below.
The Awesome Oscillator showed a bullish crossover, indicating a near-term bullish outlook. A close above $11 could take LINK to $12.5 quickly, as the VPVR showed a lack of significant trading activity in that region.
However, if LINK is successful in closing above $12.5 and can manage to hold on to the level, a reversal in trend would be the conclusion.
In related news, Chainlink and Theta joined forces to combat a multibillion-dollar ad problem.
FTX Token [FTT]
Source: FTT/USDT on TradingView
FTT ascended past a level of resistance at $3.55, but this might be reversed shortly. The RSI rose and fell through the neutral 50 line repeatedly, suggesting choppiness in the market.
Indecision in the market might cause prices to follow the previous trend, which would be bearish. This could see FTT lose $3.55 as support, and drop towards $3.28.
Crypto.com Coin [CRO]
Source: CRO/USDT on TradingView
As the moving averages show, CRO has been in a downtrend for the past month. However, the trend might be slowing down.
The 50 SMA (yellow) moved above the 20 SMA (white) to denote bearishness in the short-term. The Parabolic SAR gave a buy signal, but CRO dropped beneath the 20 moving average at press time, and a close beneath 20 SMA would show further bearishness and could push the price to $0.145.
The 100 SMA (pink) and 200 SMA (purple) were moving close to one another and had also formed a bearish crossover. This underlined the likelihood of the price heading lower, but also showed that the downtrend was not strong, given the proximity of the longer-term moving averages.

