Analysis
Chainlink, Dash, VeChain Price Analysis: 02 December
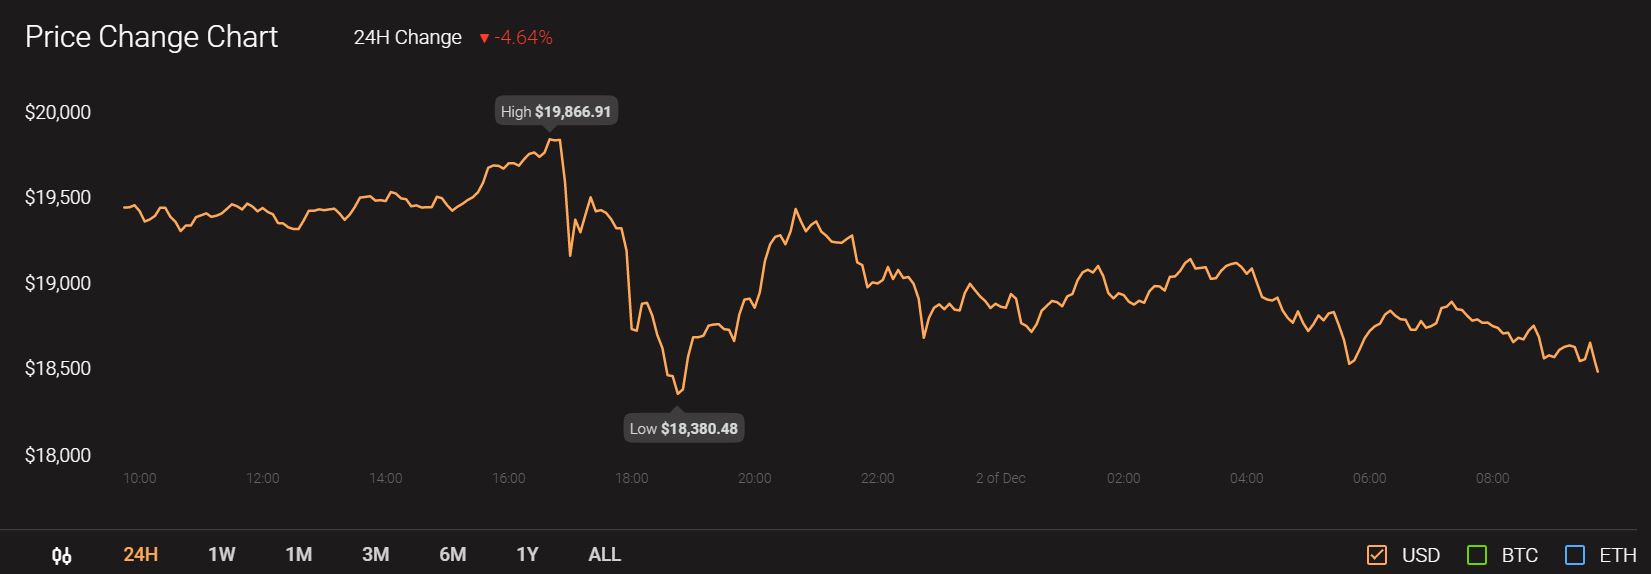
Bitcoin rose above $19,000 once more but its recent volatility resulted in weakened bullish momentum for altcoins. At press time the king coin was being traded at $18,523 with a 24-hour trading volume of $71.3 billion.
Source: CoinStats
Chainlink closed outside an ascending channel and could see $12.6 support revisited in the coming days. Dash defended $100 support well, but the bears were not yet beaten back. VeChain saw a bullish trading pattern reverse and was pushed back beneath $0.0159 resistance once more.
Chainlink [LINK]
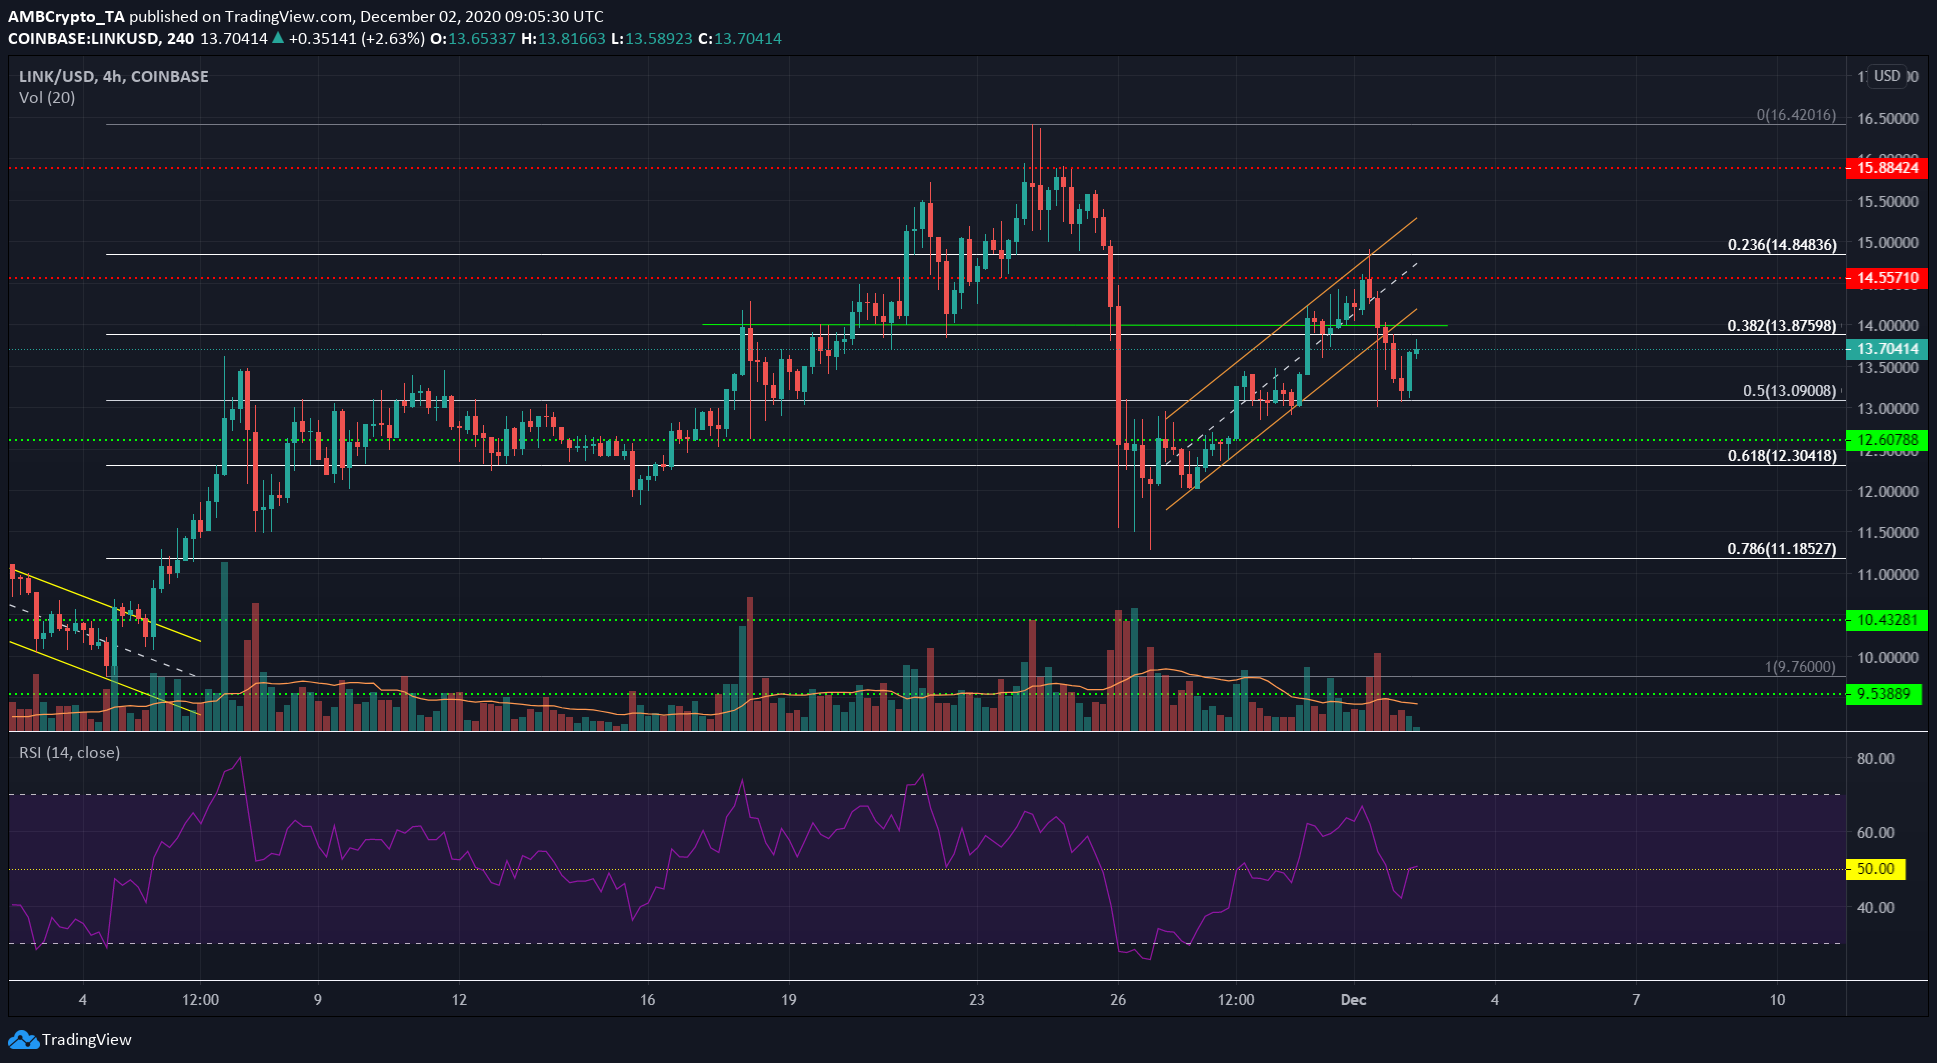
Source: LINK/USD on TradingView
LINK closed beneath the lower trendline of an ascending channel, a bearish reversal pattern. This development indicated the possibility that LINK would be forced to retrace the gains of November back to $12.3, the base of the channel.
The RSI dipped beneath neutral 50 and retested it as resistance, and could be headed lower once more. This would show a short-term downtrend in progress.
The most recent trading sessions posted gains of nearly 5.5% off the 50% Fibonacci Retracement level. Yet, this was in a trading session with low trading volume and was likely to be a bounce before another move downward for LINK in the coming hours.
Dash [DASH]
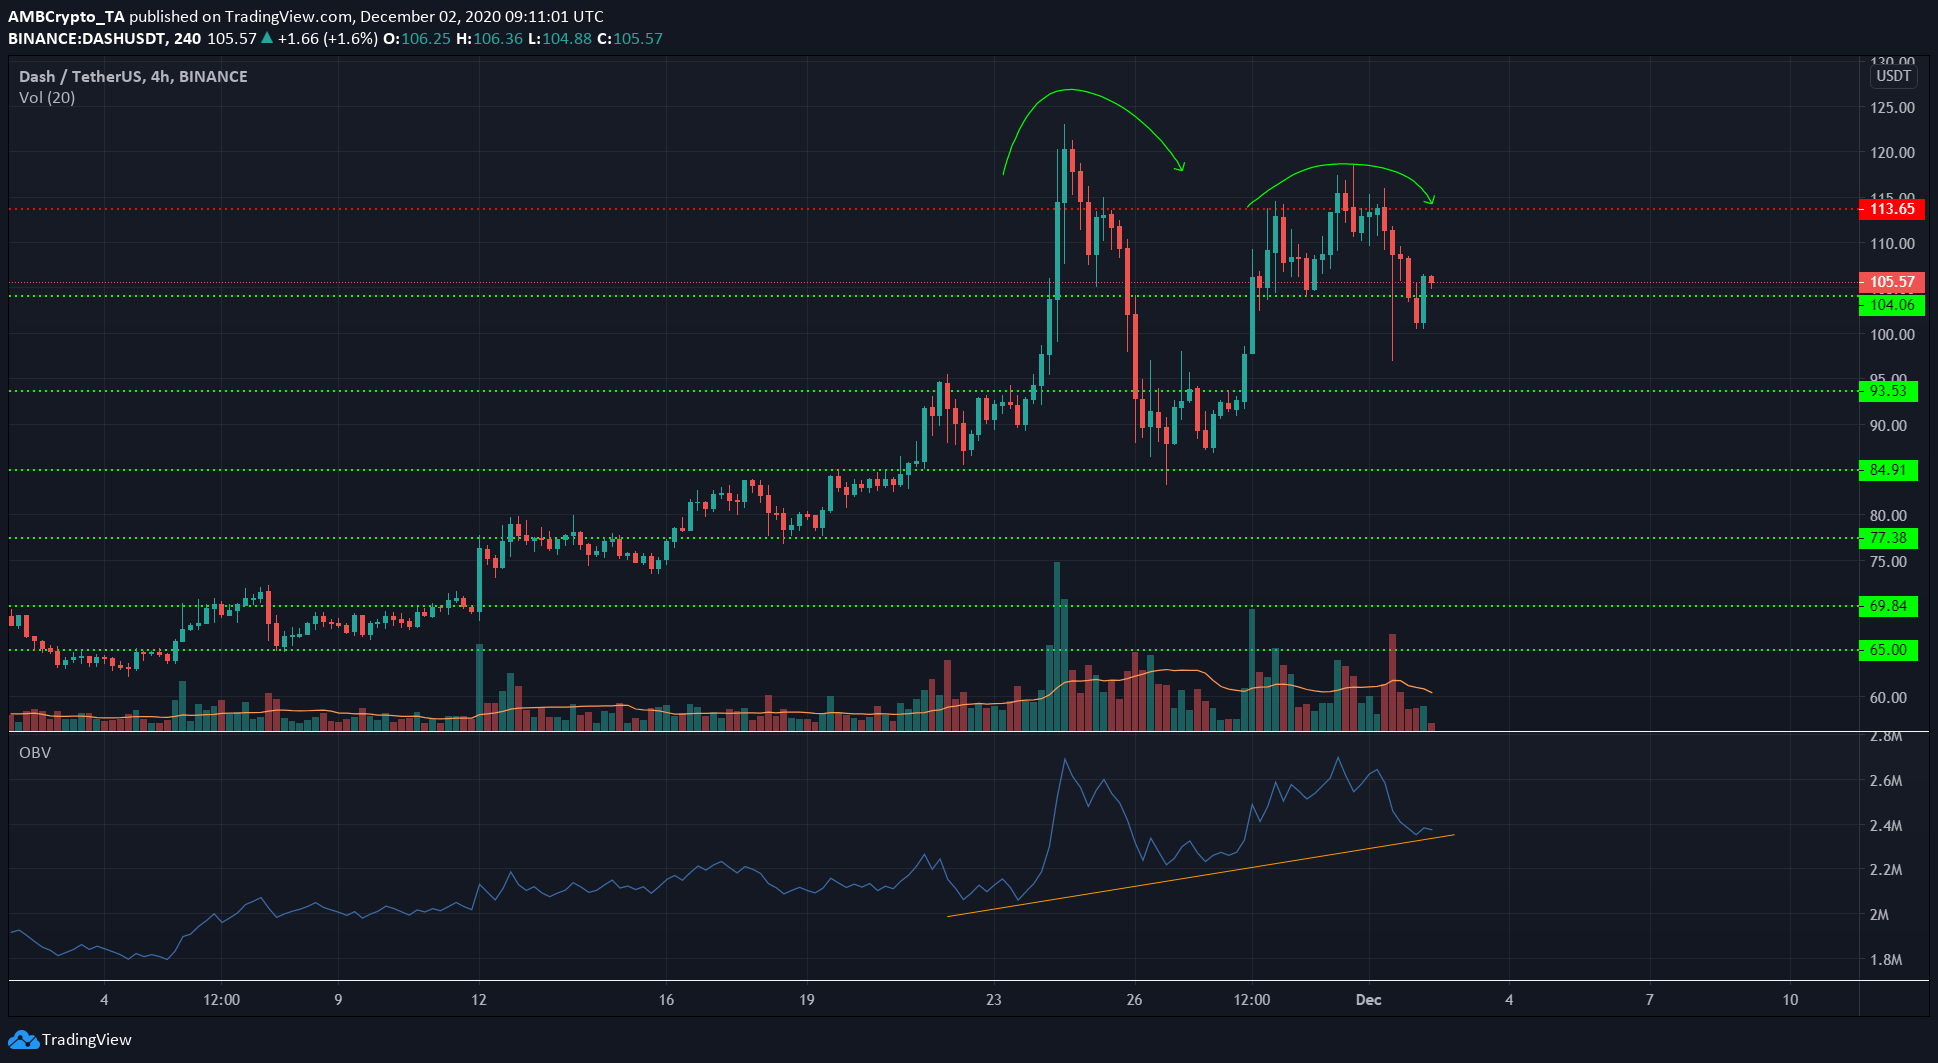
Source: DASH/USDT on TradingView
Dash appeared to form the beginnings of an Adam and Eve double top, a bearish pattern that would only be confirmed if the price closed a session beneath $86.
The defense of the $100 level was encouraging for bulls. The OBV showed that, despite the volatility in recent days, buying volume has steadily increased, with a series of higher lows posted on the indicator.
Hence, DASH appeared likely to head upward and follow the bullish sentiment of the market, unless Bitcoin or Ethereum see a deep correction. A retest of $93 support in the coming days could show a drop was imminent for DASH.
VeChain [VET]
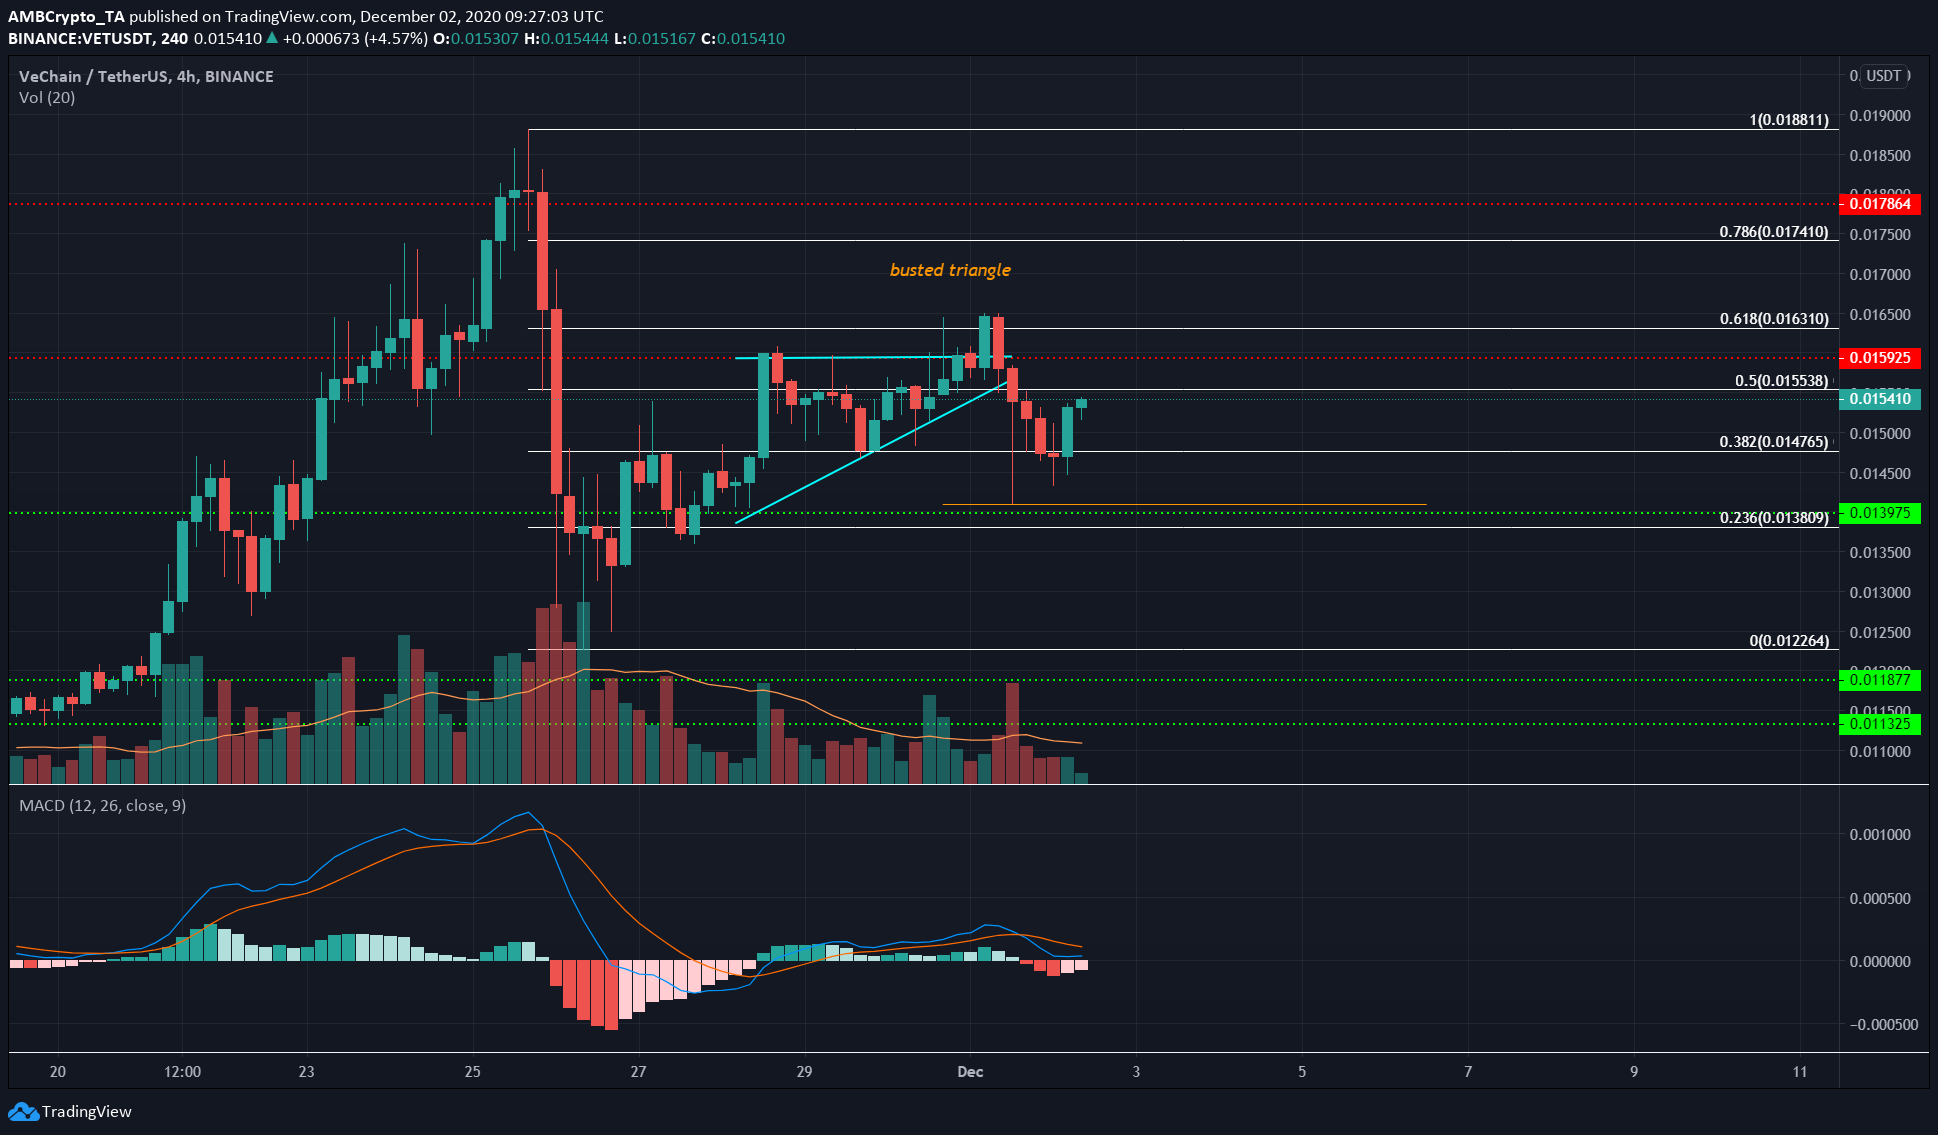
Source: VET/USDT on TradingView
An ascending triangle was spotted for VET, but it quickly turned into a busted triangle after the prices reversed upon a rise above the $0.0159 level of resistance.
A close back below the level signified VET would head toward the base of the pattern at $0.014, and a candle’s long lower can indeed be seen to touch the projected level.
The bears, aided by a volatile BTC, were successful in pushing the price beneath $0.0159 level. The MACD had formed a bearish crossover but was still above the zero line.
50% of the drop from the local high at $0.0188 to $0.0122 is represented by the $0.0155 level, and bulls would look to flip this as well as $0.0159 resistance levels to support.