Analysis
Chainlink, Cosmos, VeChain Price Analysis: 05 October

Chainlink made two attempts at an important region of resistance last week, but was rejected on both tries and could be set to post losses over the coming days. Cosmos could face rejection at its resistance once more but could post some gains in the short-term while VeChain was forming a bearish pattern and could break strongly to the downside in a few days.
Chainlink [LINK]

Source: LINK/USD on TradingView
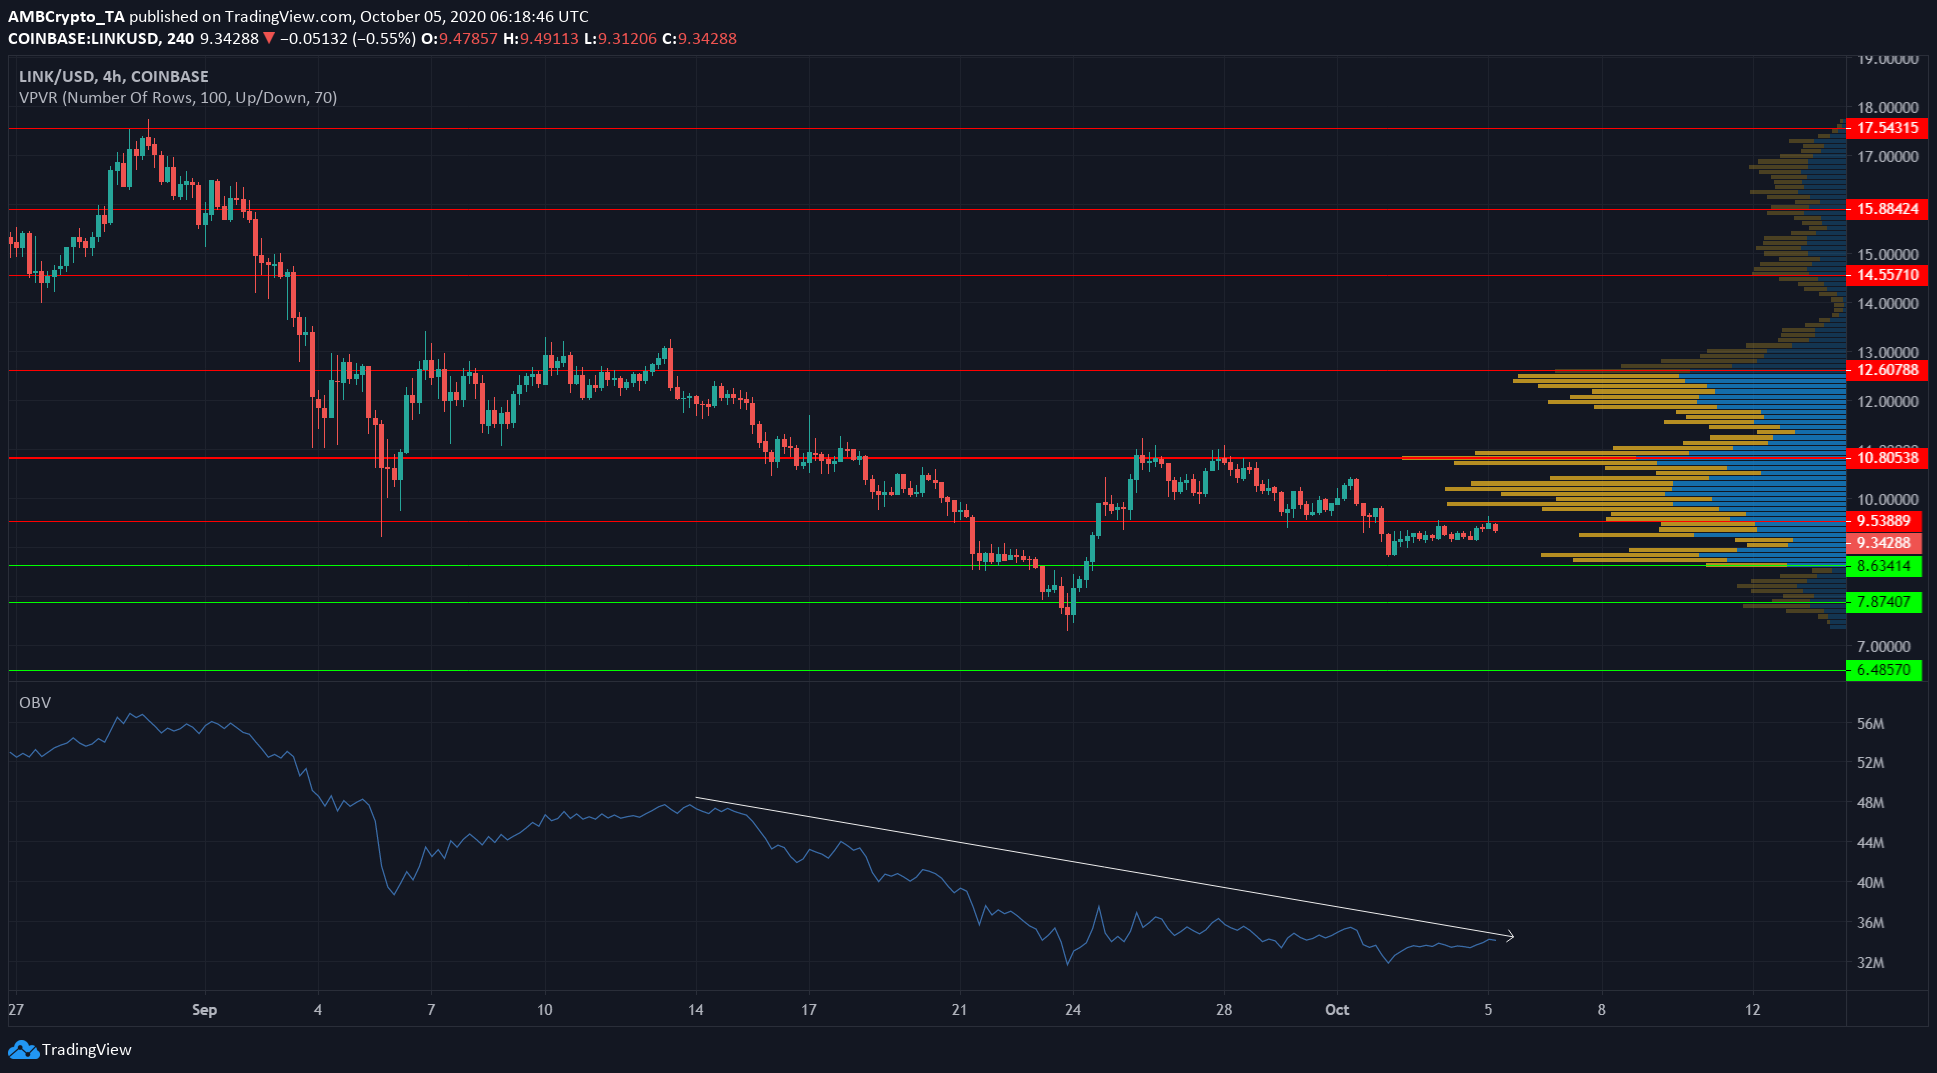
LINK used $7.8 as a springboard for a strong rise toward resistance at $10.8, but two attempts in quick succession were both rejected. As the Visible Range showed, $10.75 was a good zone of supply.
LINK slumped to $8.85, before another rise to $9.5, and was trading at $9.34 at press time. However, the failure to breach $10.75 was bearish news for the asset.
OBV also indicated that selling volume prevailed through LINK’s downtrend. The recent, high momentum move to resistance at $10.75 simply did not have enough buying volume to overwhelm the sellers. This also indicated further losses were definitely likely for the asset.
VPVR showed that $8.8 and $9.2 would be good regions of support for LINK.
In related news, the rivalry between Chainlink and Band was worth keeping an eye on, with Chainlink clearly winning the market share battle.
Cosmos [ATOM]
Source: ATOM/USD on TradingView
Cosmos was forming a descending wedge (white), a bullish reversal pattern, for the better part of September. It broke out to the upside last week, with a target at $5.85 (pink). However, the price was unable to ascend past $5.45 resistance.
ATOM dropped to find support at $4.8, and at press time it was moving within a rising channel (yellow). The channel was likely to see another rejection at $5.45. This was because, despite the gains ATOM made, its trading volume was falling (orange), indicating a disagreement between price and volume.
It was possible that ATOM would range between $4.8 and $5.45 in the coming weeks.
VeChain [VET]
Source: VET/USD on TradingView
VeChain has been trending lower for nearly two months now. Alongside the down trendline (white), a descending triangle pattern was also being formed.
A breakout to the downside was most likely for VET, with a projected target in the region of $0.007.
RSI also highlighted the bearish momentum present in the market. It showed a value of 38 at press time. It has been repeatedly driven toward the oversold region in the past few weeks in the face of selling pressure.

