Analysis
Chainlink, Cosmos, DigiByte Price Analysis: 13 September

Bitcoin surged past its resistance at $10,400 to trade at $10,547 at press time. In fact, Ethereum too noted an uptick, climbing from $366 to $386. However, while the weekend surge might continue into the weekdays, the sentiment in the Options space remains largely bearish.
Further down the crypto-ladder, Chainlink was rising towards a level of retracement. Cosmos’s outlook shifted to bullish in the near-term, following its surge over the past few days. Finally, DigiByte was consolidating beneath a level of resistance and showed a notable lack of momentum in the market.
Chainlink [LINK]

Source: LINK/USD on TradingView
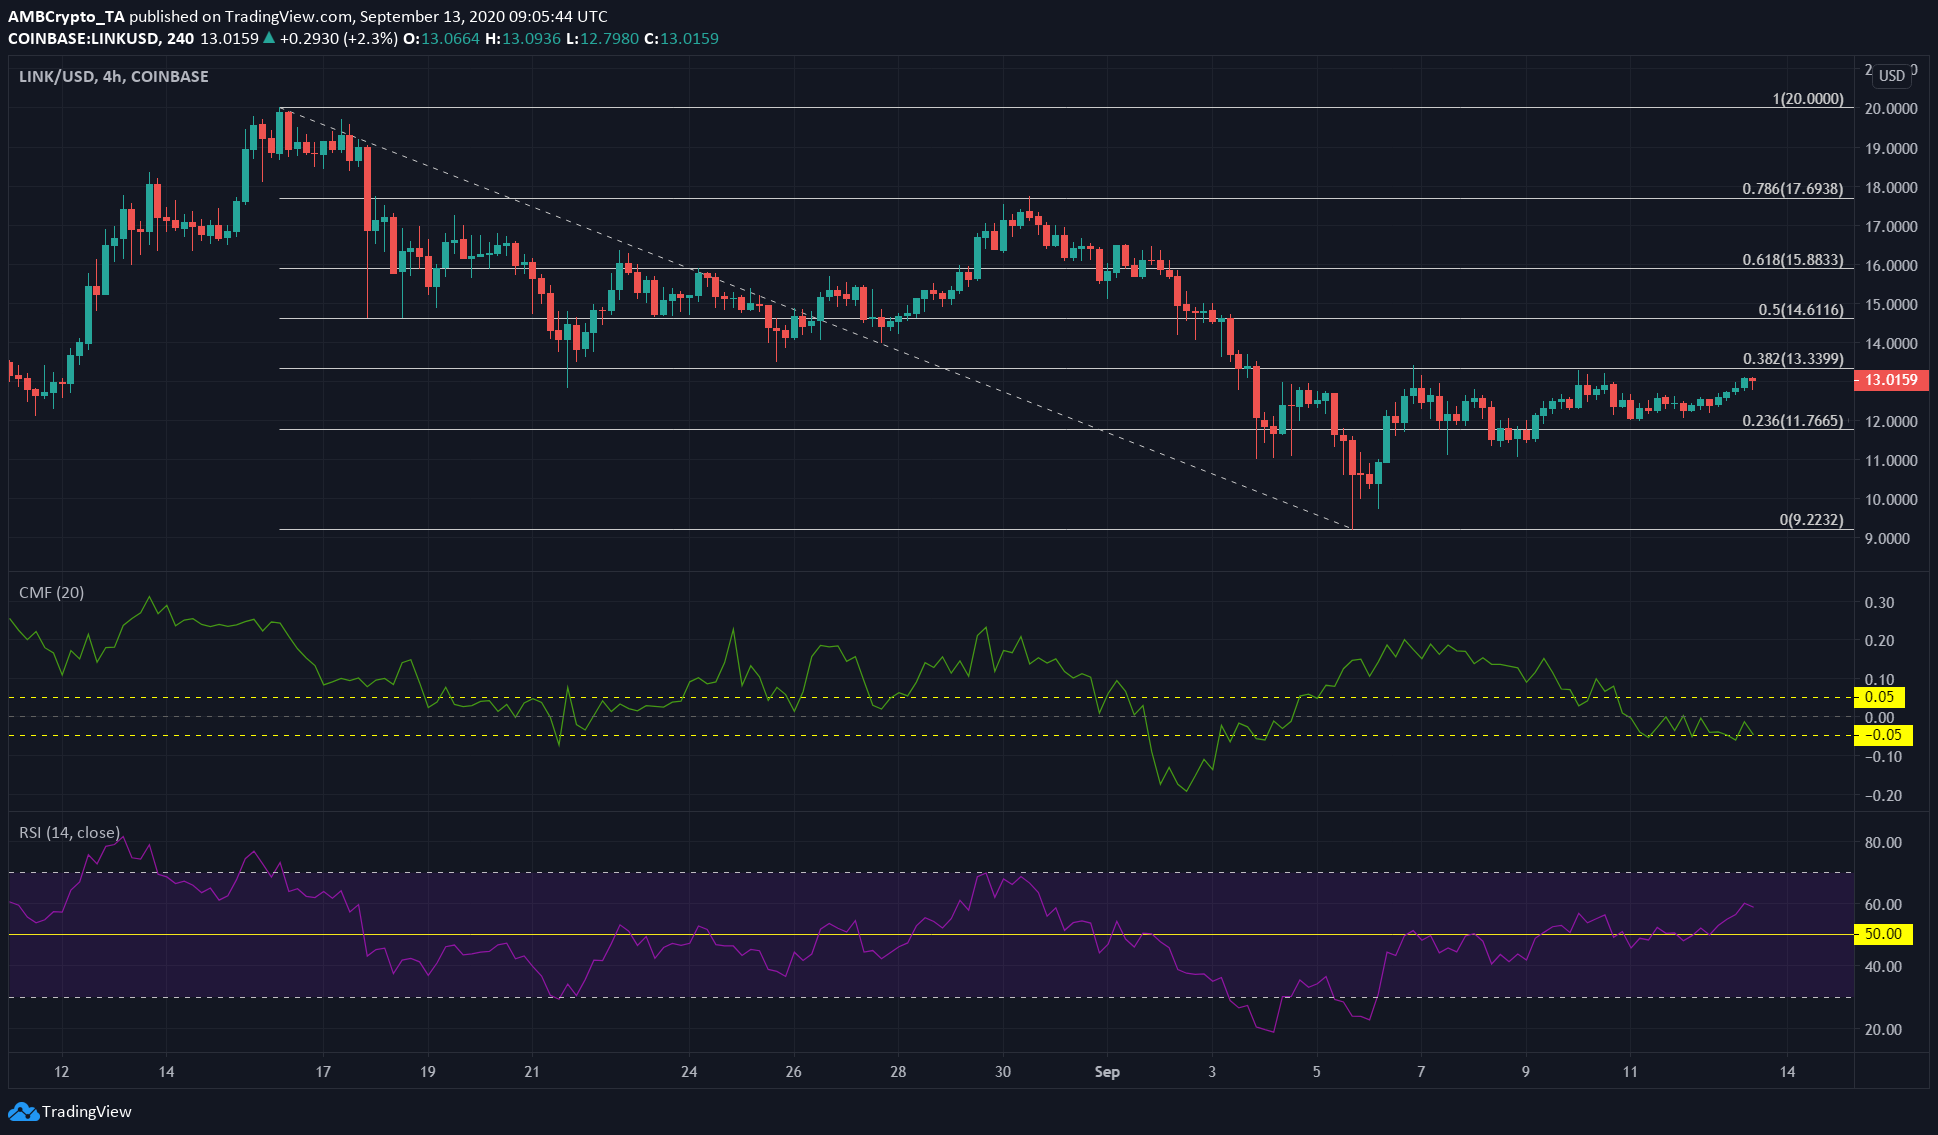
LINK was forming higher lows as it approached the 38.2% retracement level of its drop from its ATH. However, the Chaikin Money Flow did not show a significant amount of capital inflows into the market. In fact, the CMF was on the verge of showing capital outflows and sellers had begun to gain the upper hand.
The RSI was noting a bullish value of 60. If LINK surges past its resistance, it is possible that the RSI might go into the oversold zone, prompting a re-test of the $13.39 level.
A rising RSI, combined with a falling CMF, was more likely to forecast a drop in LINK’s value, than a surge past its resistance.
The number of LINK tokens held by large capital, long-term investors was also reported to be falling, while new entrants to the LINK community tended to be smaller investors.
The article also highlighted indications that many investors are using price spikes to cash out, reinforcing the idea that price rise would be met by a wave of selling pressure.
Cosmos [ATOM]
Source: ATOM/USD on TradingView
ATOM bounced off its support at $4.81 to test resistance at $5.45, a level where it was rejected. The price used the 20 SMA (white) as support and surged past the $5.45 level.
The 20 SMA crossed above its 50 SMA (yellow) to indicate bullishness in the near-term. However, the price still had the 100 SMA (pink), as well as the resistance at $6.15, impeding its recovery.
Further, the Parabolic SAR also pointed to a buy signal. If ATOM were to face a sell-off, it could find support once more around its moving averages.
DigiByte [DGB]
Source: DGB/USD on TradingView
DGB was valued at $0.0227 and was trading right beneath its level of resistance at $0.0229.
The Bollinger Bands were converging around the cryptocurrency’s price, indicating consolidation. A breakout will be confirmed if it is accompanied by good trading volume.
Finally, the Awesome Oscillator showed weak bullish momentum. Overall, DGB was more likely to spike, than to drop.

