Analysis
Cardano’s price takes another hit as coin breaches descending triangle
Cardano’s price peaked in June 2019. However, since then, its price has been tumbling. The coin has remained in the bearish zone and failed to report any notable spike in its price. The market trend at press time, denoted a strong bearish presence in ADA’s market as its value stood at $0.0442 with a market cap of $1.07 billion.
The short-term chart for the coin reported a breach of the descending triangle and suggested high bearish pressure in the market.
1-hour

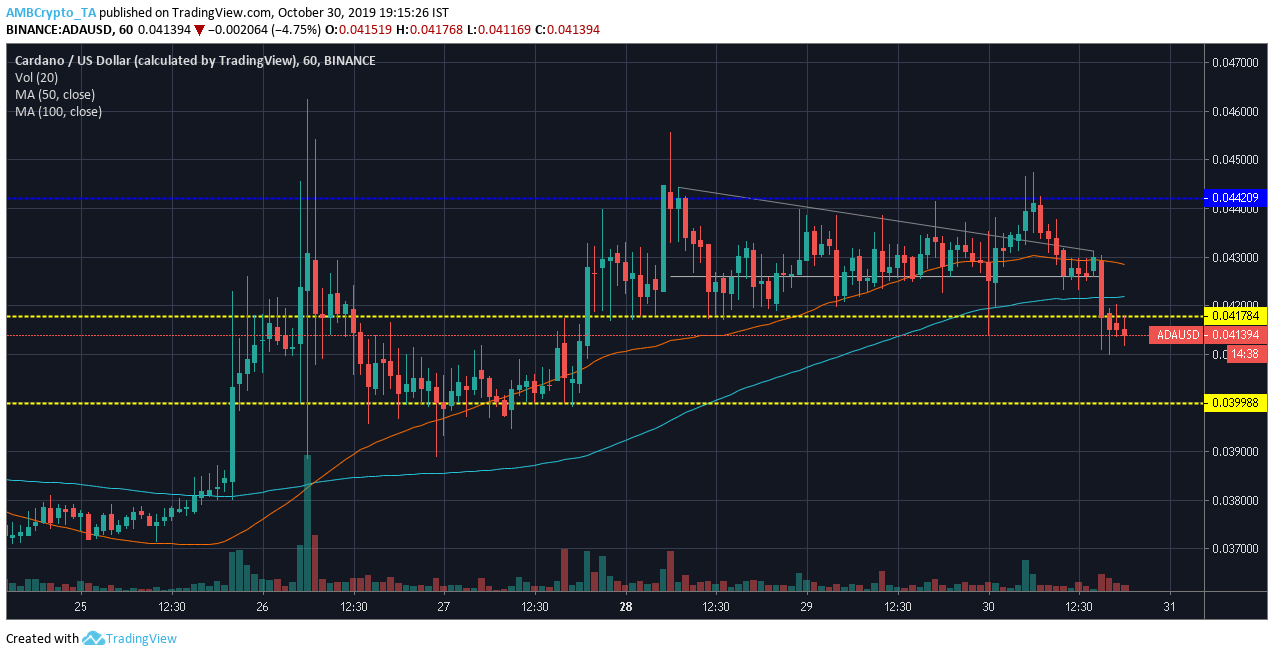
Source: ADA/USD on TradingView
The one hour chart for ADA reflected the formation of a descending triangle pattern that extended across days. The pattern characterized by a slope connected the lower highs at $0.0443, $0.0439, $0.0434, and $0.0430, while the support was marked at $0.0425. The coin recorded a loss of 2.92% in its value within the triangle and noted another devaluation of 3.91% on breach of the pattern.
However, the Moving average 50 aligned above the 100 Moving average for the fourth consecutive day. The building bearish momentum might reverse this trend.

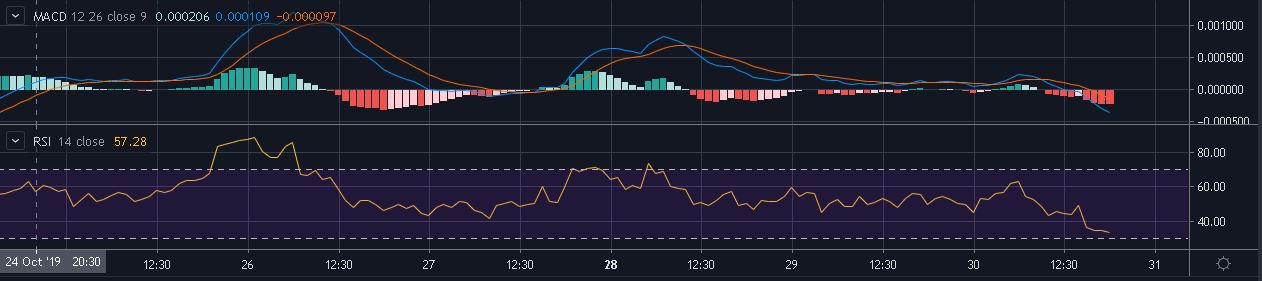
Source: ADA/USD on TradingView
The MACD indicator implied strong bearish tides as the MACD line lay under the signal line. On the other hand, the Relative Strength Index reported the coin’s descent towards the oversold zone, an indicator of bearishness in the ADA market.
Conclusion
Cardano showed no sign of recovery from the breach of the descending triangle as the indicators also reflected bearish dominance in the market. The next support for the coin was marked at $0.0399, while the price treads close.

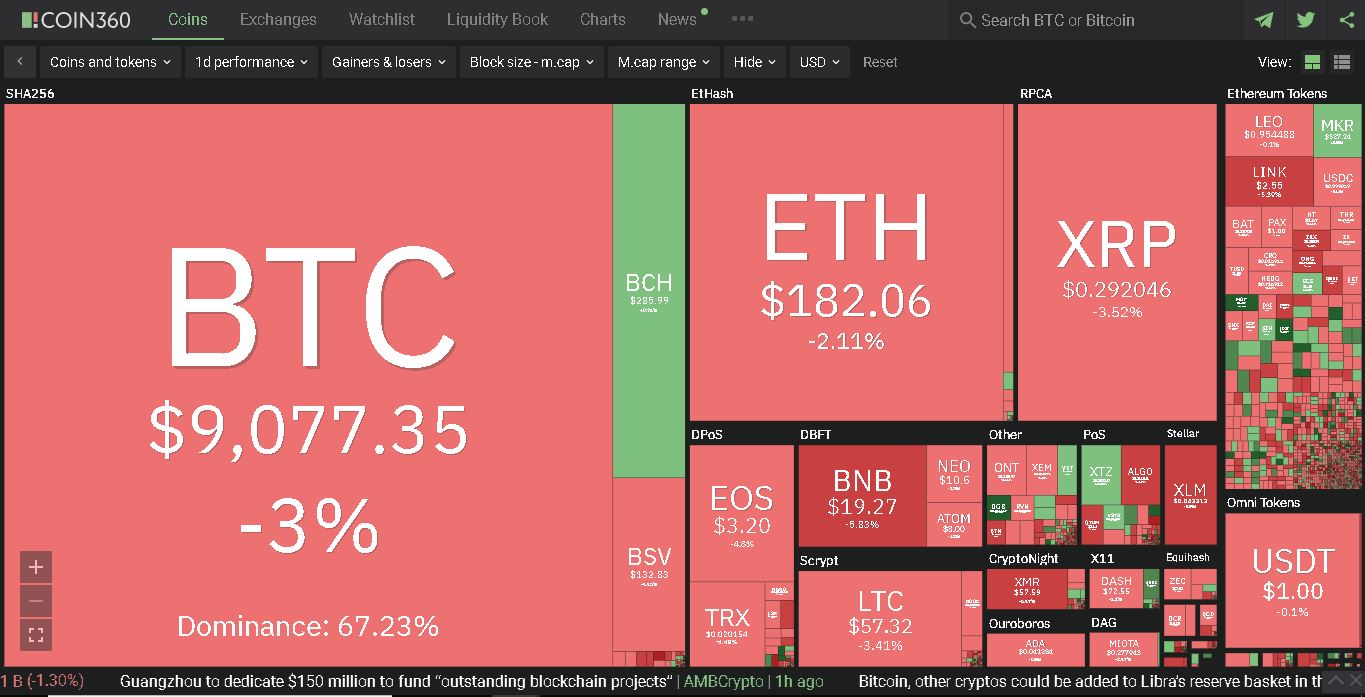
Source: Coin360


