Analysis
Cardano’s breach of descending triangle opens door for new yearly low

After a long bullish rally at the start of 2019, the collective crypto-market collapsed on 23 October, a collapse which saw the top virtual assets recording some major depreciation.
When compared to top assets like Bitcoin or XRP, Cardano suffered significantly at the hands of the bears after it fell by over 11.87 percent, registering a new yearly low at $0.0344.
However, upon analysis, it seems that the worst is not over yet.
Daily chart

Source: ADA/USD at Trading View
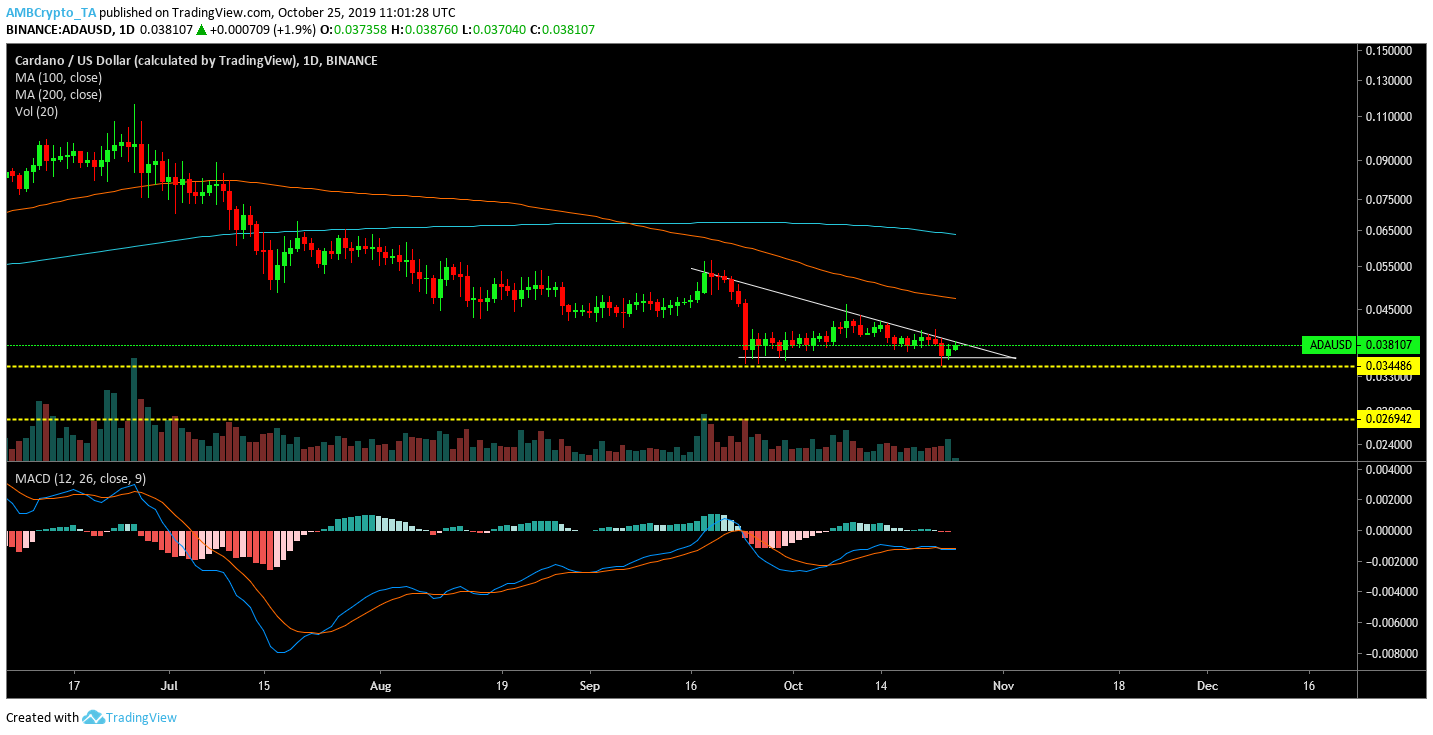
Cardano’s price has been steadily declining over the past few weeks, but a small bullish breach was caught, just before the major collapse on 24 September. At press time, the price movement of ADA depicted the formation of a descending triangle, a development which opened the possibility for another bearish breakout. The base of the triangle has acted as support three times and the decreasing trade volume confirmed the validity of the pattern.
A bearish breakout would see the price re-test the close support at $0.0344 and a massive price fall may see ADA register a new yearly low for 2019 at around $0.026.
The MACD indicator was also a bearish sign as the signal line was above the MACD line.
12-hour chart
Source: ADA/USD at Trading View
The 12-hour chart reiterated the same pattern with respect to the 1-day analysis, as another descending triangle was observed. The moving averages also completed a bearish crossover and saw the 200-Moving Average navigating above the 100-Moving Average.
The Relative Strength Index was on an incline at press time, which was a bullish sign. However, the RSI had a strong resistance at the 49.79 mark and there is the possibility of higher selling pressure prevailing, according to a majority of the indicators.
The breach of support at $0.0269 will pave the way for a new low, as 2019 is slowly becoming another bearish year for Cardano.

