Cardano, Zcash, Monero Price Analysis: 16 October

The recent price dip in Bitcoin post the drop in early October, seemed to be having a significant impact on the prices of altcoins, as the sellers took control of the trading charts.
Barring a few, almost the entire crypto market was once again painted in red. Cardano was displaying strong selling sentiment, as it witnessed a bearish breakout below the trendline.
Bears in the Monero and Zcash market too were starting to build downward momentum, as prices for both approached key support levels.
Cardano [ADA]

Source: ADA/USD on TradingView
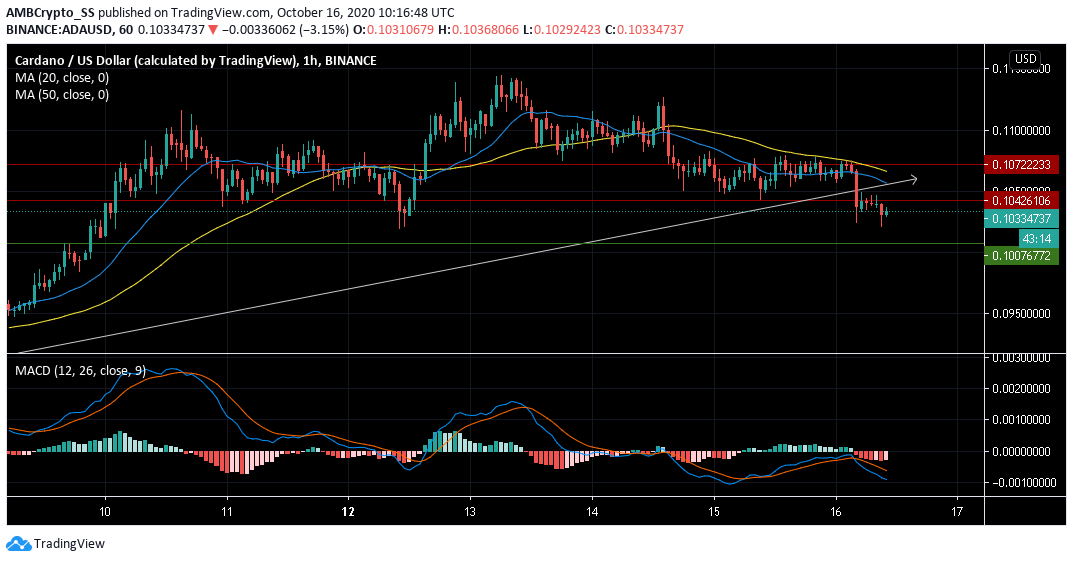
Cardano the ninth-largest cryptocurrency fell under the crypto spotlight with an 11% decrease in price since Monday. The altcoin recorded almost 3% daily losses which pushed down its prices further down to the $0.1033 level.
The major price dump witnessed a loss of stability below the key $0.1042 resistance level, well below its two moving averages.
In fact, in a clear bearish scenario, the 50 period SMA was lying above the 20 SMA, indicating the bears were gaining selling momentum in the short-medium term period.
MACD too was highly bearish as both the MACD and signal lines dived below the zero line, indicating the possibility of another sell-off till the next support at $ 0.1007
Monero [XMR]

Source: XMR/USD on TradingView
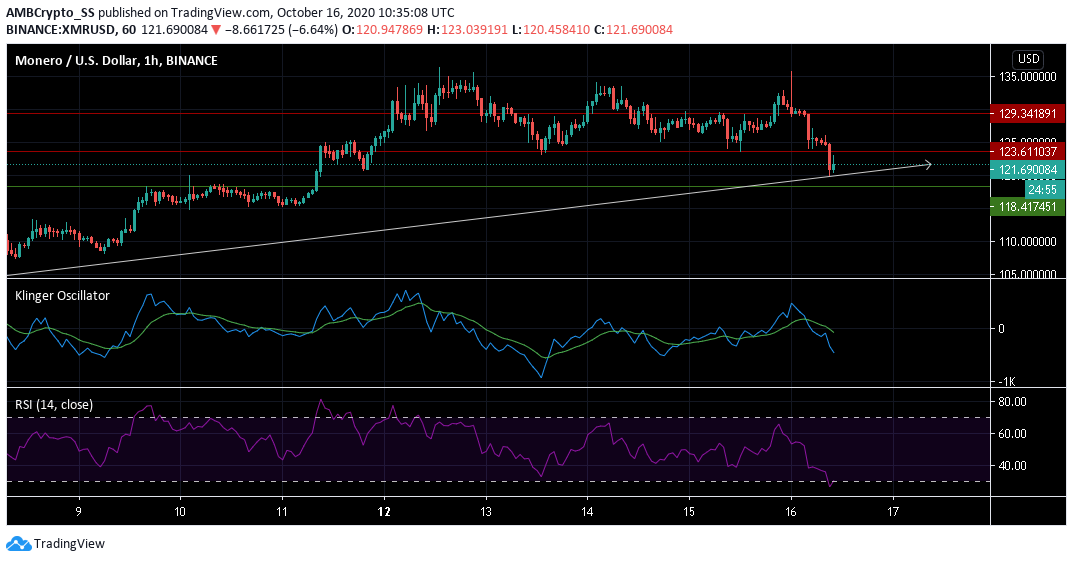
The Monero market was dwelling on the negative side as strong bearish sentiment was witnessed. Down by almost 6% since yesterday the digital asset, at press time was trading at $ 121.69
The Klinger Oscillator underwent a bearish crossover and highlighted a potential dive down to the $ 118.417 level which has been a critical support zone.
The Relative Strength Index (RSI) was in the oversold territory. The RSI marker was just below the 30 level with prominent seller activity.
Zcash [ZEC]

Source: ZEC/USD on TradingView
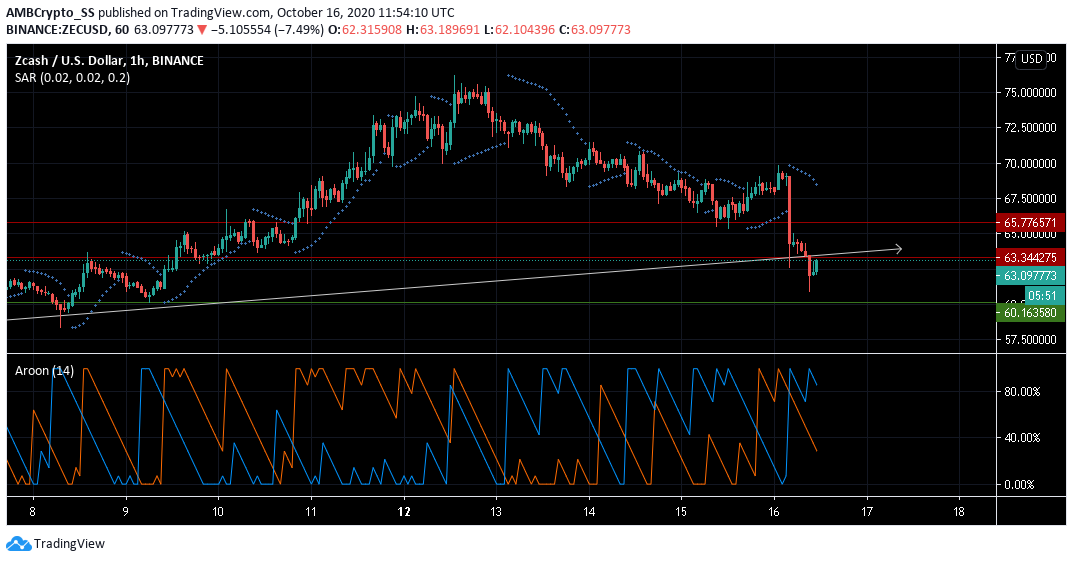
Zcash endured a notable price dump by almost 7.5% over the last 24 hours. At the time of writing, the coin’s market cap was recorded to be $641 million.
The dotted lines of the Parabolic SAR above the price candles signaled a downtrend.
The Aroon Indicator too hinted towards a short-term bearishness, since the Aroon Up (orange) dived below the Aroon down (blue).
The high level of bearishness captured by the technical indicators of the digital asset meant a further downtrend towards the $ 60.163 level of support remained a likely scenario.


