
- AMB surpassed the $0.40 psychological level, but active addresses failed to grow.
- Technical indicators suggest a further hike for ADA.
For the last few days, Solana [SOL] has been the best-performing cryptocurrency out of the top 10 per market capitalization. But, in the last 24 hours, SOL has passed that baton to Cardano [ADA].
AMBCrypto critically looked at the ADA price action and observed that the token value had increased by 11.24 within the aforementioned timeframe. In the process, ADA broke the $0.40 psychological level.
While this hike served as an impressive showing, the same could not be said of the Cardano network. One reason for this was because of the Price-Daily Active Addresses (DAA) divergence.
Dwindling activity now is not bad news
According to AMBCrypto’s analysis of Santiment’s data, active addresses on the Cardano network decreased as the price surged.
For context, the DAA is one of the best on-chain metrics for evaluating overall user activity on a blockchain.
The metric also has a significant impact on a cryptocurrency’s value. At press time, ADA’s price-DAA was -43.16%.
Using the price-DAA divergence strategy, the price growth over the active addresses could serve as a buy signal for short to mid-term investors.
![Cardano [ADA] price-daily active addreses divergence](https://engamb.b-cdn.net/wp-content/uploads/2023/11/Cardano-ADA-09.58.06-16-Nov-2023-scaled.jpg)
Source: Santiment
But from the metric mentioned above, buying ADA at $0.40 may not be a bad idea.
From the ADA/USD 4-hour chart, the 9-day EMA (blue) had crossed over the 20 EMA (yellow). This flip indicates that the token’s trend was still bullish. So, the ADA price may continue to increase.
The Accumulation/Distribution (A/D) line also supported the uptrend.
This was because the A/D surged, suggesting that there was more accumulation than distribution of ADA. In terms of entry/exit, one indicator to consider is the Know Sure Thing (KST).
A buy signal occurs when the KST crosses above the zero line, indicating a positive shift in momentum. Conversely, when the indicator goes below the zero line, traders should take it as a sell signal.
![Cardano [ADA] price analysis](https://engamb.b-cdn.net/wp-content/uploads/2023/11/ADAUSD_2023-11-16_10-10-30.png)
Source: TradingView
Traders are ready to pull the trigger
At the time of writing, the KST had closed in on crossing the zero line. So, traders should carefully observe the trend at this point.
If the KST finally jumps above the zero midpoint, alongside the aforementioned DAA divergence, then ADA may be ready for another uptick.
Additionally, it seemed traders were already taking the cure from the on-chain data and technical perspective. This was indicated by the funding rate.
Read Cardano’s [ADA] Price Prediction 2024-2025
A positive funding rate implies that traders are bullish on a cryptocurrency.
On the other hand, a negative funding rate suggests a bearish sentiment. At press time, ADA’s funding rate was 0.01%, confirming the bullish bias traders have.
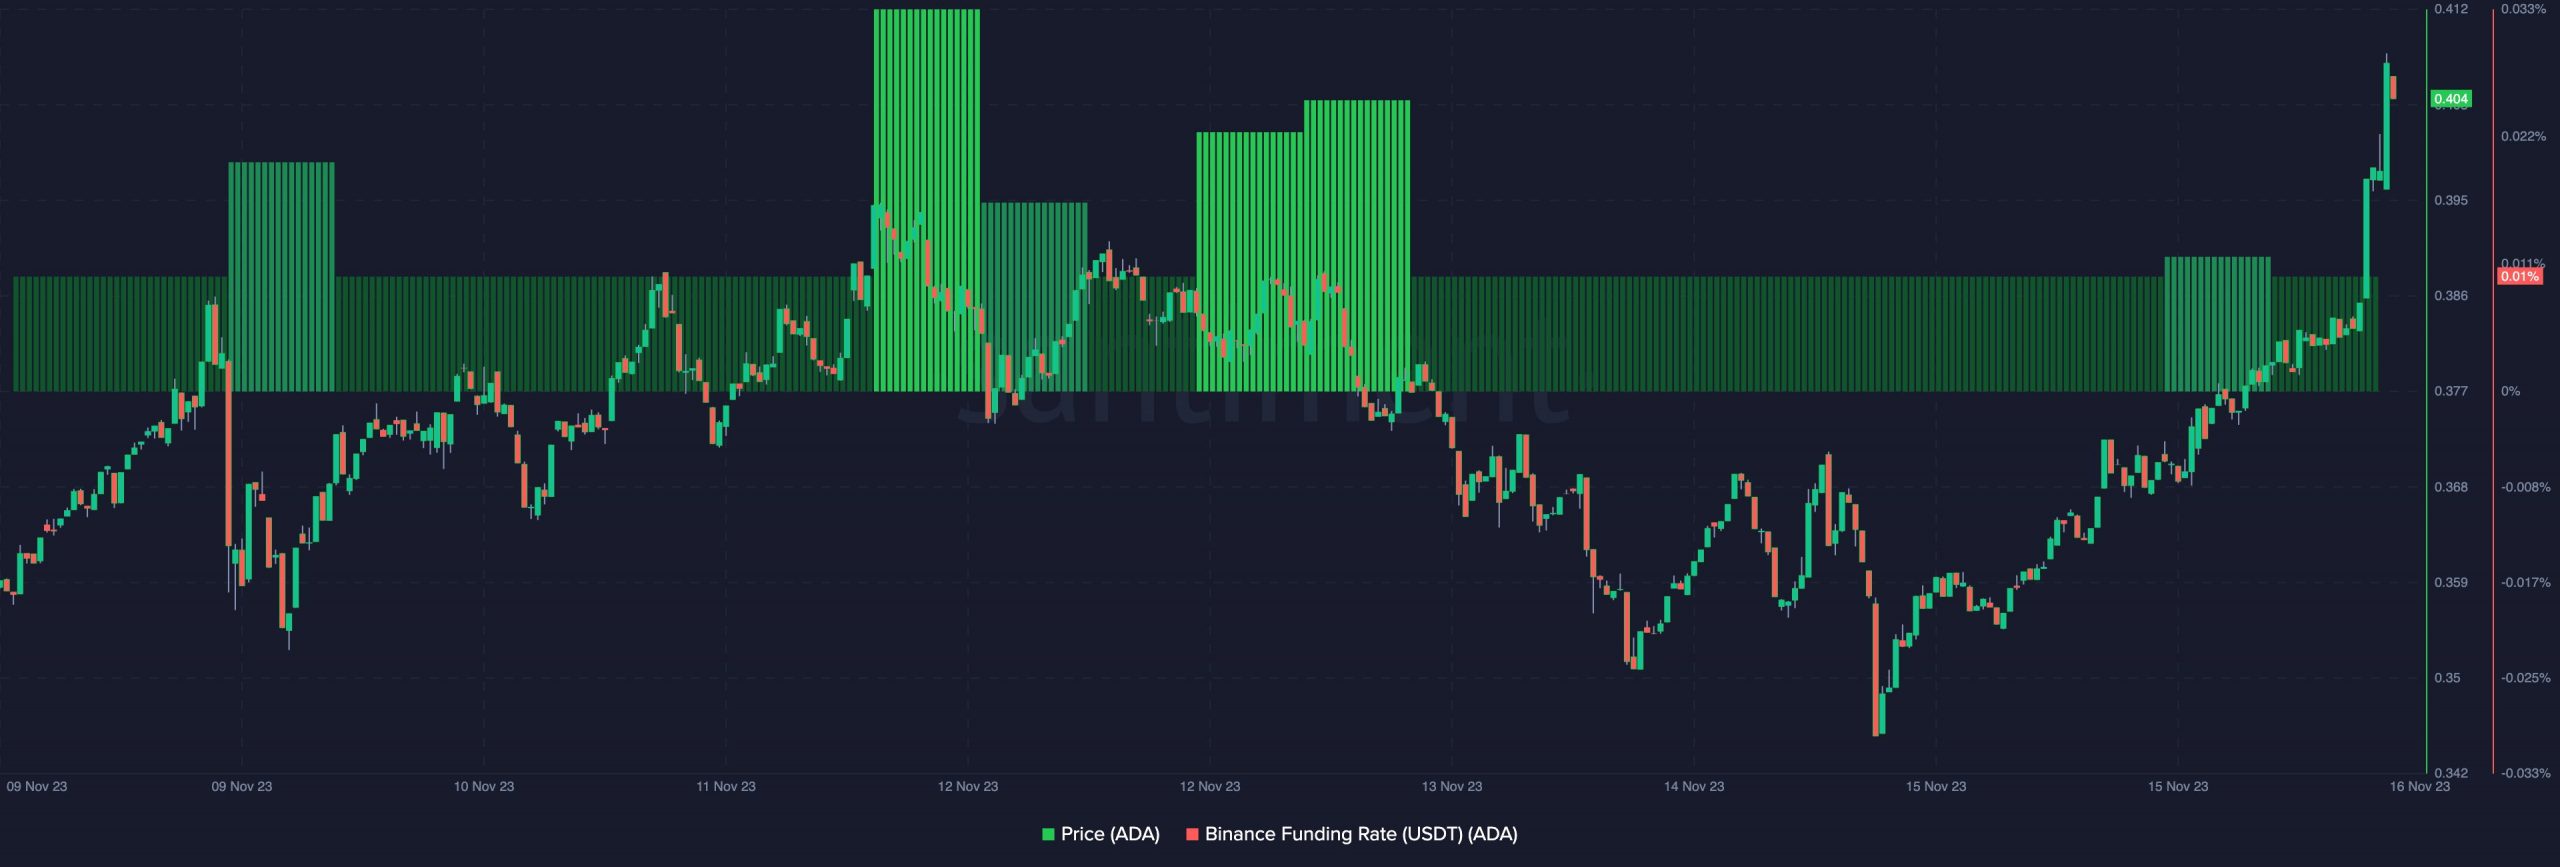
Source: Santiment