
Cardano has been the most dominant altcoin in the market since it recouped 100 percent of its lost price in June. At press time, it is posting a double-digit 24-hour price gain, the highest among the top-10 and occupies the 6th spot on the coin ladder, with a market capitalization of $3.83 billion, ahead of coins like Bitcoin SV, Litecoin and Binance Coin.
No doubt ADA market was buoyed by Bitcoin rise over $9,600, but the altcoin already had a lot of momentum going for it, and now its price of $0.148 has reached an almost two-year high. This isolated rise is remarkable especially given some altcoins haven’t even managed to recover the Black Thursday losses of March 2020. Given the rapidity of Cardano’s price rise, no pattern fits its daily chart, apart from the bullish upward channel, but there are key levels in sight, some of which the altcoin has broken, and some of which it is yet to encounter on this continued 5-month long bull-run.
Since trading in a somewhat sideways but upward skewed movement in April and May, Cardano managed to breakout in mid-May, followed by a big breakout at the end of the month. This breakout allowed it to go past its first resistance at $0.088, which it bounced off-of in June 2019. Once ADA was locked in this bull-run, beginning in June, 44 percent price rise in under a month and a half saw it break two other resistance levels at $0.105 and $0.127 respectively.
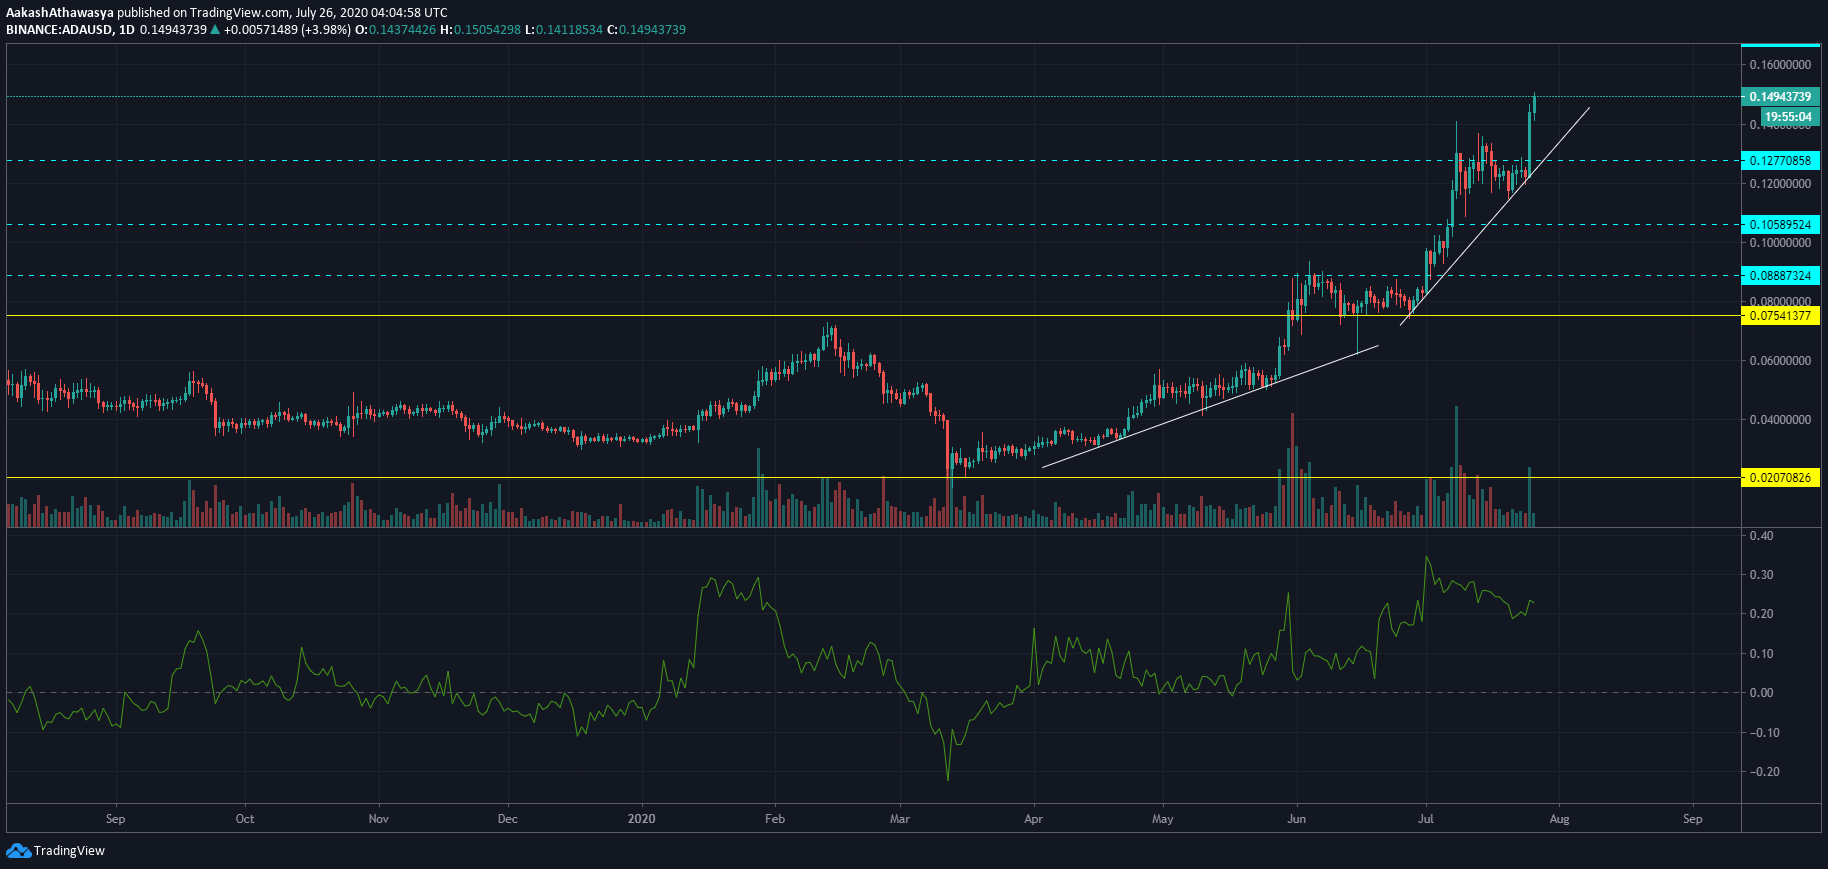
Source: ADAUSD via Trading View
This push from June saw a trend line on the lower-end of the price-scale form which it managed to glide past on two occasions. Most recently during Cardano’s move was the $0.127 resistance level, the trend line was touched [but not broken] as the price pushed as high as $0.148, where it stands at press time. No immediate resistance levels lie ahead, but zooming out and looking at the weekly-chart, resistance can be found at $0.163 and $0.23 respectively.
An interesting contradiction in the Cardano charts is its money inflow. While the price has risen by double-digits with each week at the beginning of the month, Chaikin Money Flow indicator has been falling since the end of June. On 30 June, CMF was at a yearly-high of 0.34, and began dropping steadily, reaching a low of 0.18 on 20 July before a move up. This is indicative of a decreasing inflow of new-money into ADA despite the price rise, which could signal a further increase if tapped.
Cardano has had an unassailable surge over the past few months, pushing its price and position on the coin ladder higher and higher. As things stand its most recent move past $0.13 has not been accompanied by rising volume of new-money, which could fuel yet another rise. However, given the severity of the rise, skepticism may force a pull-out and if so, support lies at the lower-bottom of the trend line at $0.131, and the levels of $0.127 and $0.105 respectively.