Analysis
Cardano could plunge further down ascending parallel pattern

Cardano’s [ADA] price has suffered downside pressure since the last week of September, despite brief upward momentum following major upgrades in the Cardano ecosystem.
The coin dropped to a low of $0.036, before its price revival to the upside. Despite the latest Bitcoin rally however, ADA failed to post significant gains as opposed to its peer altcoins. At press time, the coin was trading at $0.042 and had a market cap of $1.09 billion, with the coin recording a 24-hour trading volume of $122 million.
Cardano 6-hour Chart

Source: ADA/USD on TradingView
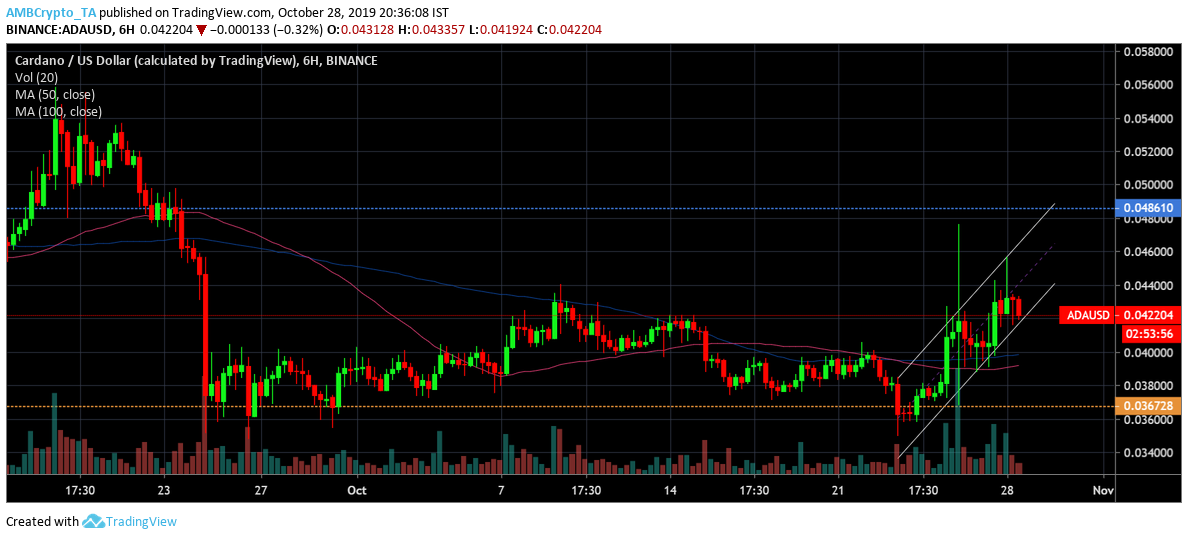
Cardano’s [ADA] 6-hour chart displayed the formation of an ascending parallel pattern, with the price following two trendlines moving upwards. This indicated a bearish breakout after the closure of the pattern. The moving average aligned with the bears. Here, the 100 moving average was above the 50 moving average, indicative of a potential negative breakout.
The Cardano bulls resisted below $0.045. Another major resistance point was found at $0.048, a level not seen since the losses incurred in September. If the trend persists, a further decline would trigger a fall in price and ADA could find itself testing support at key $0.036 level.
Source: ADA/USD on TradingView
The MACD was above the signal line, suggesting a potentially bullish period for the coin. The RSI indicator was above the 50 median line, indicating a bullish phase among Cardano investors.
Conclusion
Despite indicators calling for a bullish breakout, Cardano’s pattern formation and moving averages could lead to a downward spiral. The coin could go back to the crucial $0.036 level.

