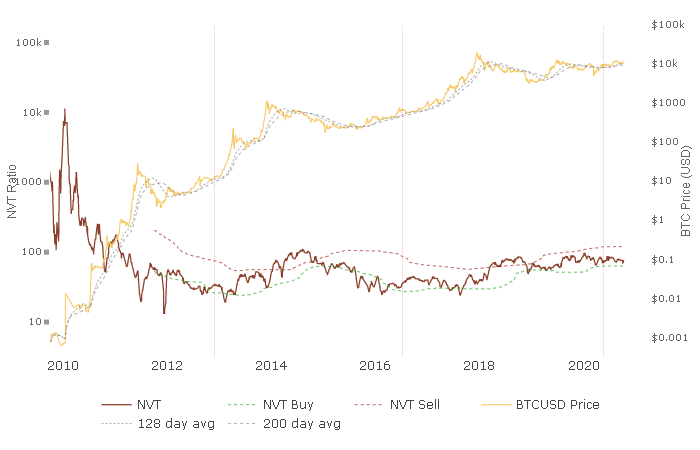
Both these metrics hint at a big buy signal for Bitcoin

Bitcoin’s NVT [Network Value to Transaction ratio] metric is used to determine whether an asset is bullish or bearish. However, using it in tandem with other indicators/metrics works the best.
What does it signify?
Put it simply, the metric shows if the network is being used a lot or not. If the NVT is high, it means that the network is in high demand and usage ie., more seem to be investing in it. Conversely, if NVT is low, it means that people aren’t using the blockchain a lot.
Typically, when the NVT ratio is low, it would mean the network usage is less and investors aren’t actively investing.
At press time, Bitcoin’s NVT is at a level last seen during the earlier phase of the COVID pandemic. This means that the bitcoin network isn’t being used as much. This would mean investors aren’t actively investing in bitcoin.
This might seem bearish, but it isn’t and it might even sound preposterous considering MicroStrategy and CashApp’s investment. However, as mentioned earlier, this metric is supposed to be used in conjunction with other metrics.
Here’s why low NVT is bullish for bitcoin:
- A low NVT ratio is seen usually near the price bottoms; ergo price can be expected to rise higher. Last time, NVT was this low, the price was in the low $5000-range. Since then, the price has more than doubled. So, we can expect the same to happen even now.
- Difficulty Bands – This metric accounts for bitcoin miners and network difficulty, basically, the backbone of the bitcoin network. This metric is bullish when the bands are squeezed and also a good time to invest. The ribbon consists of simple moving averages of Bitcoin network difficulty so the rate of change of difficulty can be easily seen.
- The previous article talks about Mayer multiple for bitcoin and how this indicator has also lit up a bullish sign.
All-in-all, on-chain metrics for Bitcoin look strong and indicate a bullish future for bitcoin soon.
As for the technical side of things, bitcoin has printed 6 consecutive green candles. From the past, this has happened only 15 times since 2015 and indicates an average surge of 36.14% over the course of 14 days.
Hence, we can conclude that both, on-chain aka fundamentals and technicals favor bitcoin bulls.


