
- BTC was down by nearly 1% over the last 24 hours.
- Social metrics were high, but other indicators looked bearish.
Bitcoin [BTC] has not been very volatile of late, as its price took a sideways trajectory. As AMBCrypto reported earlier, investors might have to expect a few more slow-moving days, which was further established by the latest datasets.
Notably, Bitcoin’s MACD and Money Flow Index (MFI) looked bearish. But can anything cause a change in the trend in the near term?
Bitcoin might not get volatile
IntoTheBlock recently posted a tweet highlighting that the 30-day average intraday move for Bitcoin was going lower than traditional markets. This indicated a period of relatively low volatility for BTC.
Moreover, AMBCrypto found that while BTC’s price went sideways, its Open Interest remained relatively high. High Open Interest generally indicates that the ongoing price trend might continue further.
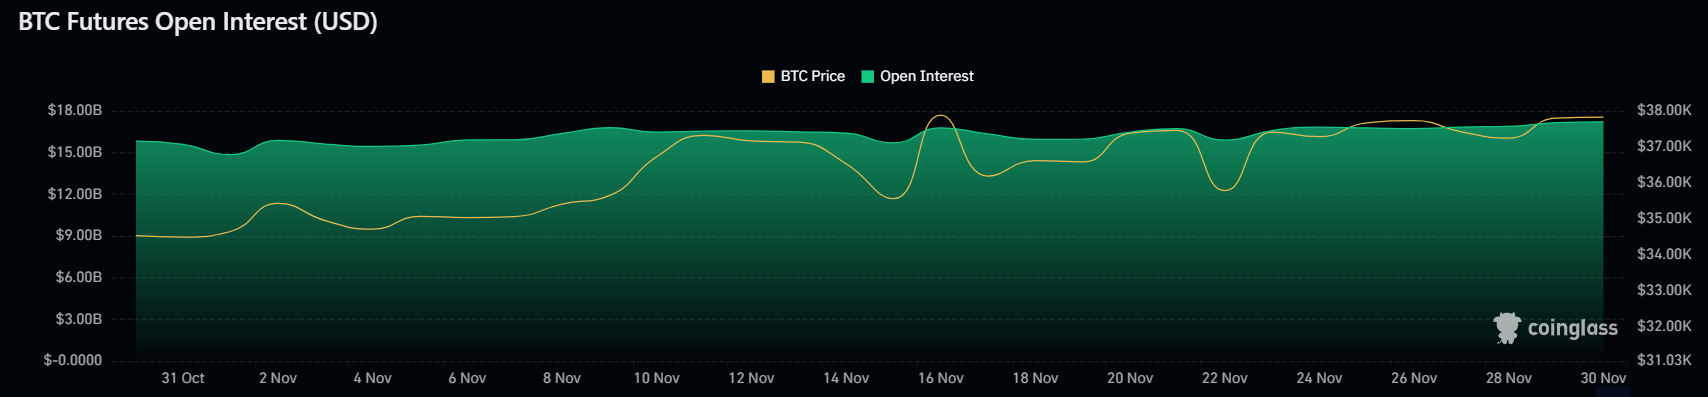
Source: Coinglass
Has anything changed overnight?
Though BTC did not register much movement, investors continued to accumulate at press time. This was evident from the fact that BTC’s Exchange Outflow spiked in the recent past.
On top of that, BTC’s Supply on Exchanges remained lower than its Supply outside of Exchanges, suggesting that buying pressure on the coin was higher than selling pressure, reflecting investors’ confidence in the king of cryptos.
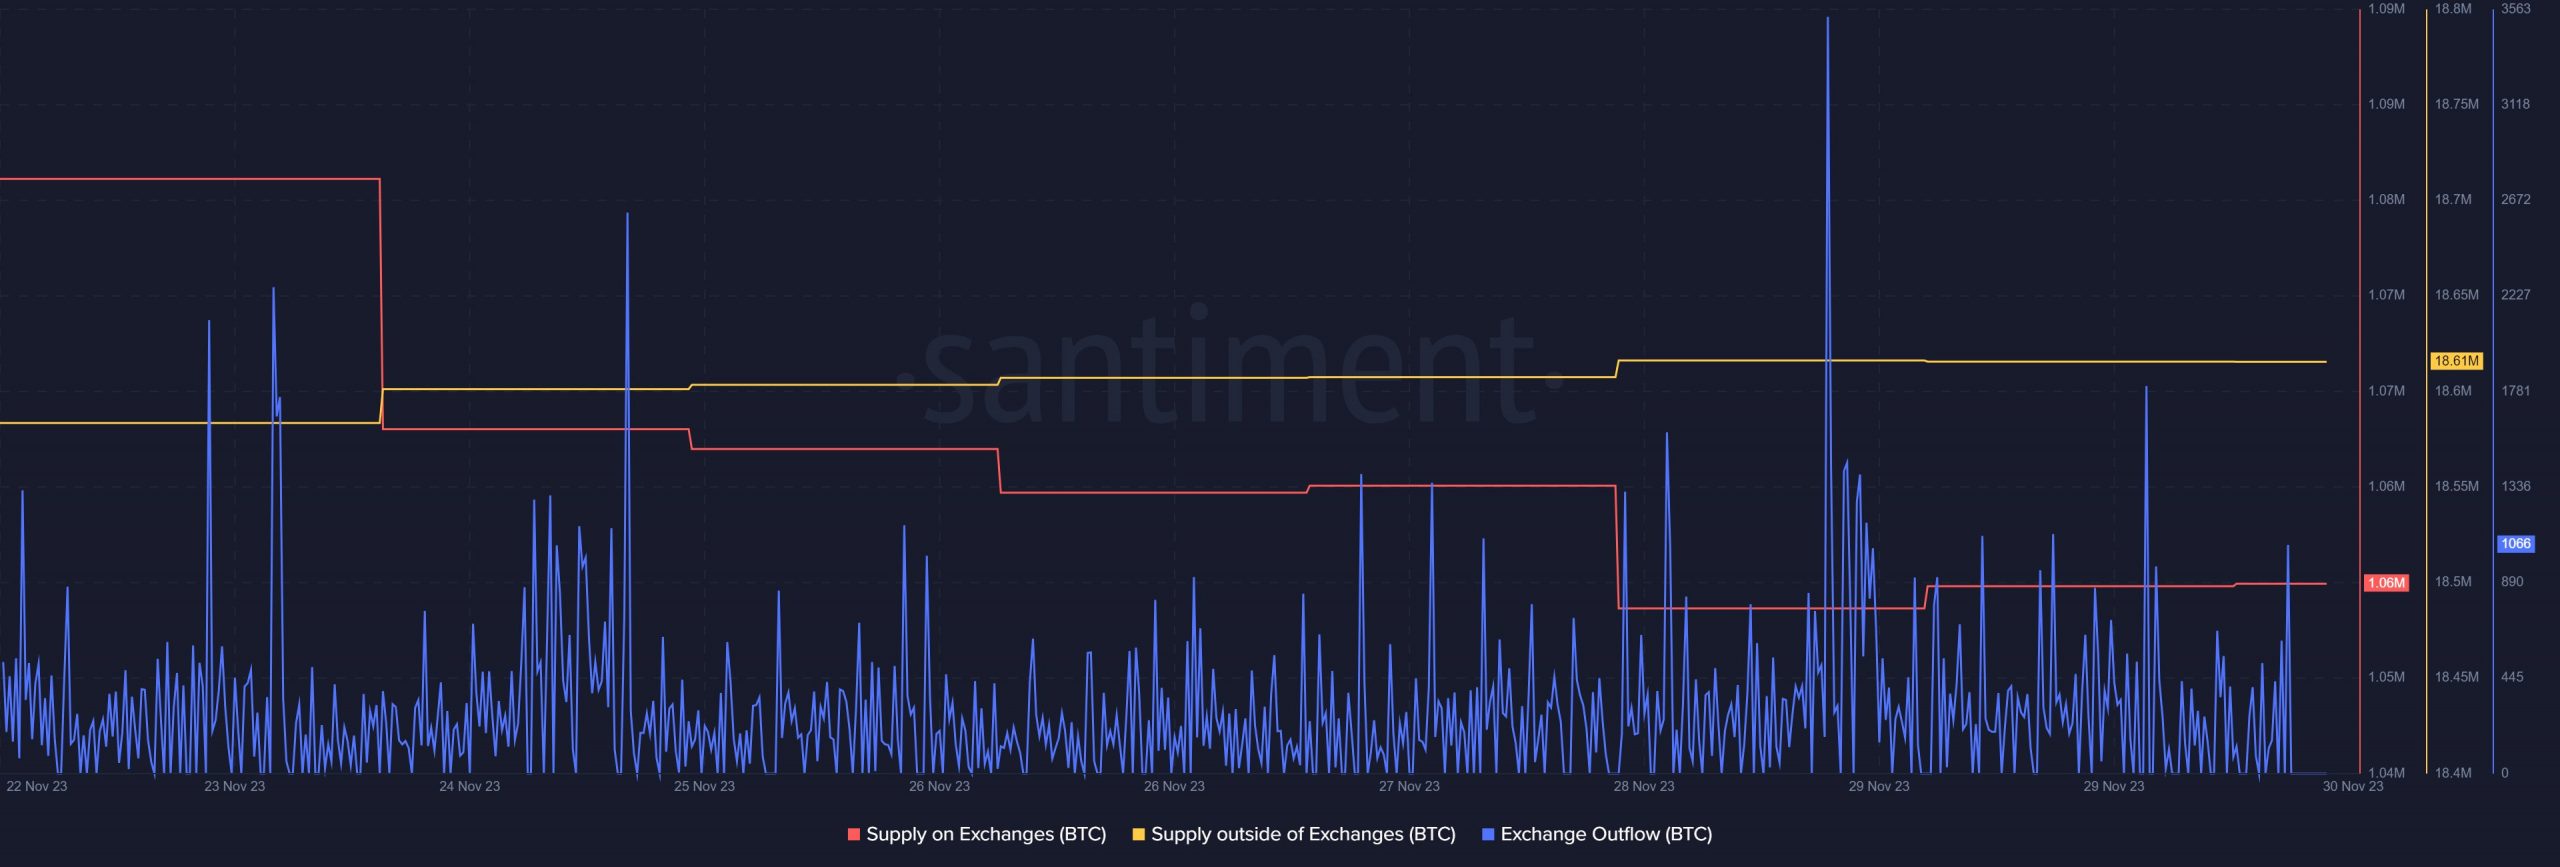
Source: Santiment
Things looked good for BTC on the social front too, as its Social Dominance surged by more than 50% over the last week. But despite the sluggish price movement, Bitcoin’s Market Dominance registered an increase, which looked optimistic.
However, a bearish metric was the coin’s AltRank, which increased over the last seven days.
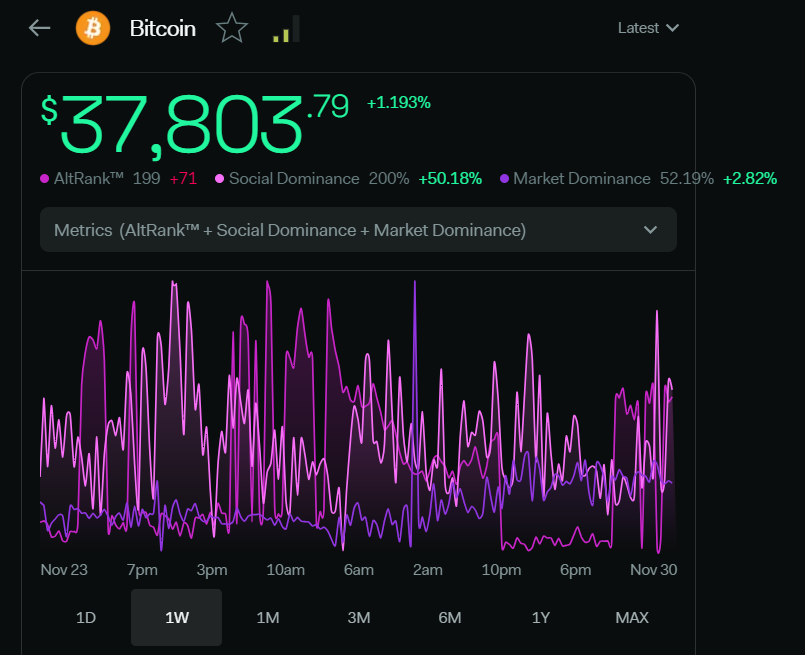
Source: LunarCrush
When AMBCrypto checked BTC’s daily chart, we found that not much had changed over the last few hours. The MACD continued to show an ongoing tussle between the bulls and the bears at press time.
Read Bitcoin’s [BTC] Price Prediction 2023-24
The Bollinger Bands’ data also revealed that the coin’s price was in a less volatile zone.
However, the Relative Strength Index (RSI) went sideways, but its Money Flow Index (MFI) looked bullish as it moved up slightly in the recent past. At press time, BTC was trading at $37,787.55, with a market capitalization of over $739 billion.
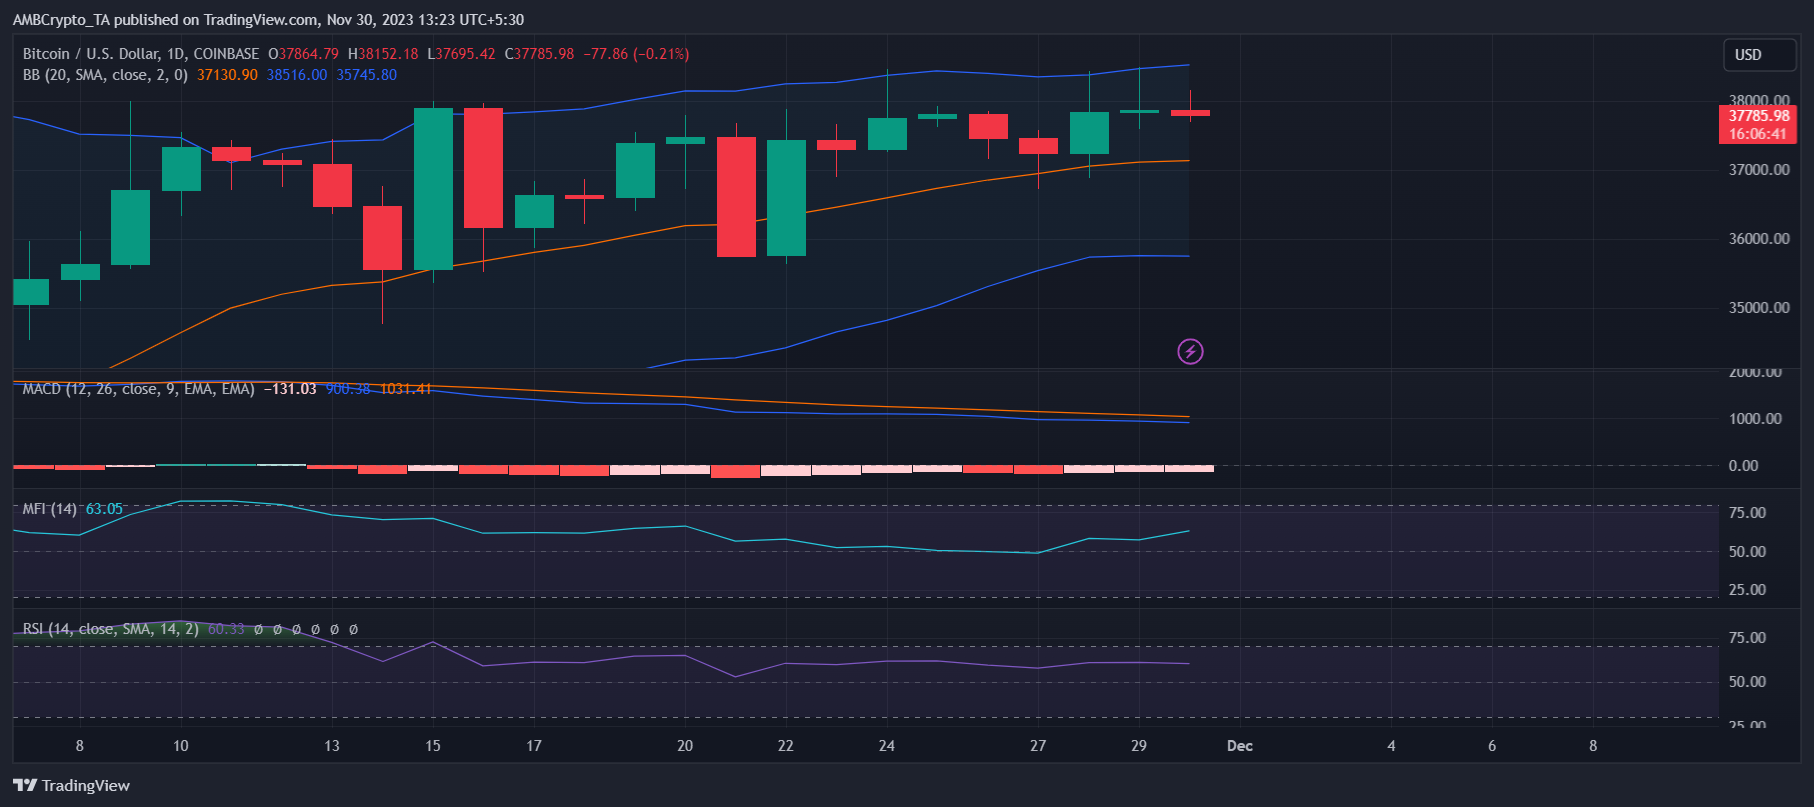
Source: TradingView