With Bitcoin breaking $10,000 there is excitement and anxiety. At this important point in cryptocurrency’s market, perhaps the most important point of 2020, two questions arise – where does this push take the price and what is this pump a consequence of? While the first question is left best out of the hands of optimistic bag-hodlers, the second can be looked at with key historic evidence.
Looking back over the last two months, there’s very little doubt that this pump was expected. With block rewards halved, amid a pandemic halting consumption and global supply, financial markets losing millions and central banks pumping liquidity, a breakout for the uncorrelated or safe-haven asset, call it what you will, was warranted, even if it was late by a few months. But if this is a halving induced pump, how does it compare to its predecessors?
According to a report by Ecoinometrics the third Bitcoin-halving induced price pump is fairly languid, or “middle of the road,” in their words. With the 2012 halving causing a stall and then rise, and the 2016 halving first dipping then rising, the 2020 pump was not rushed but just “on schedule.” Given the context of the market, a strong recovery does bear significance,
“The third halving occurred while Bitcoin was in a recovery phase from the lows of March. So there was no dip to start the cycle. But the takeoff hasn’t started either. “
On the volatility front, there’s been a “marginal reduction,” stated the report. While the first and second halvings saw immediate price actions, the 2020 one was succeeded by a flat trading window. In fact between mid-June and mid-July Bitcoin’s 30-day realized volatility was at 23 percent, its lowest since March 2019.
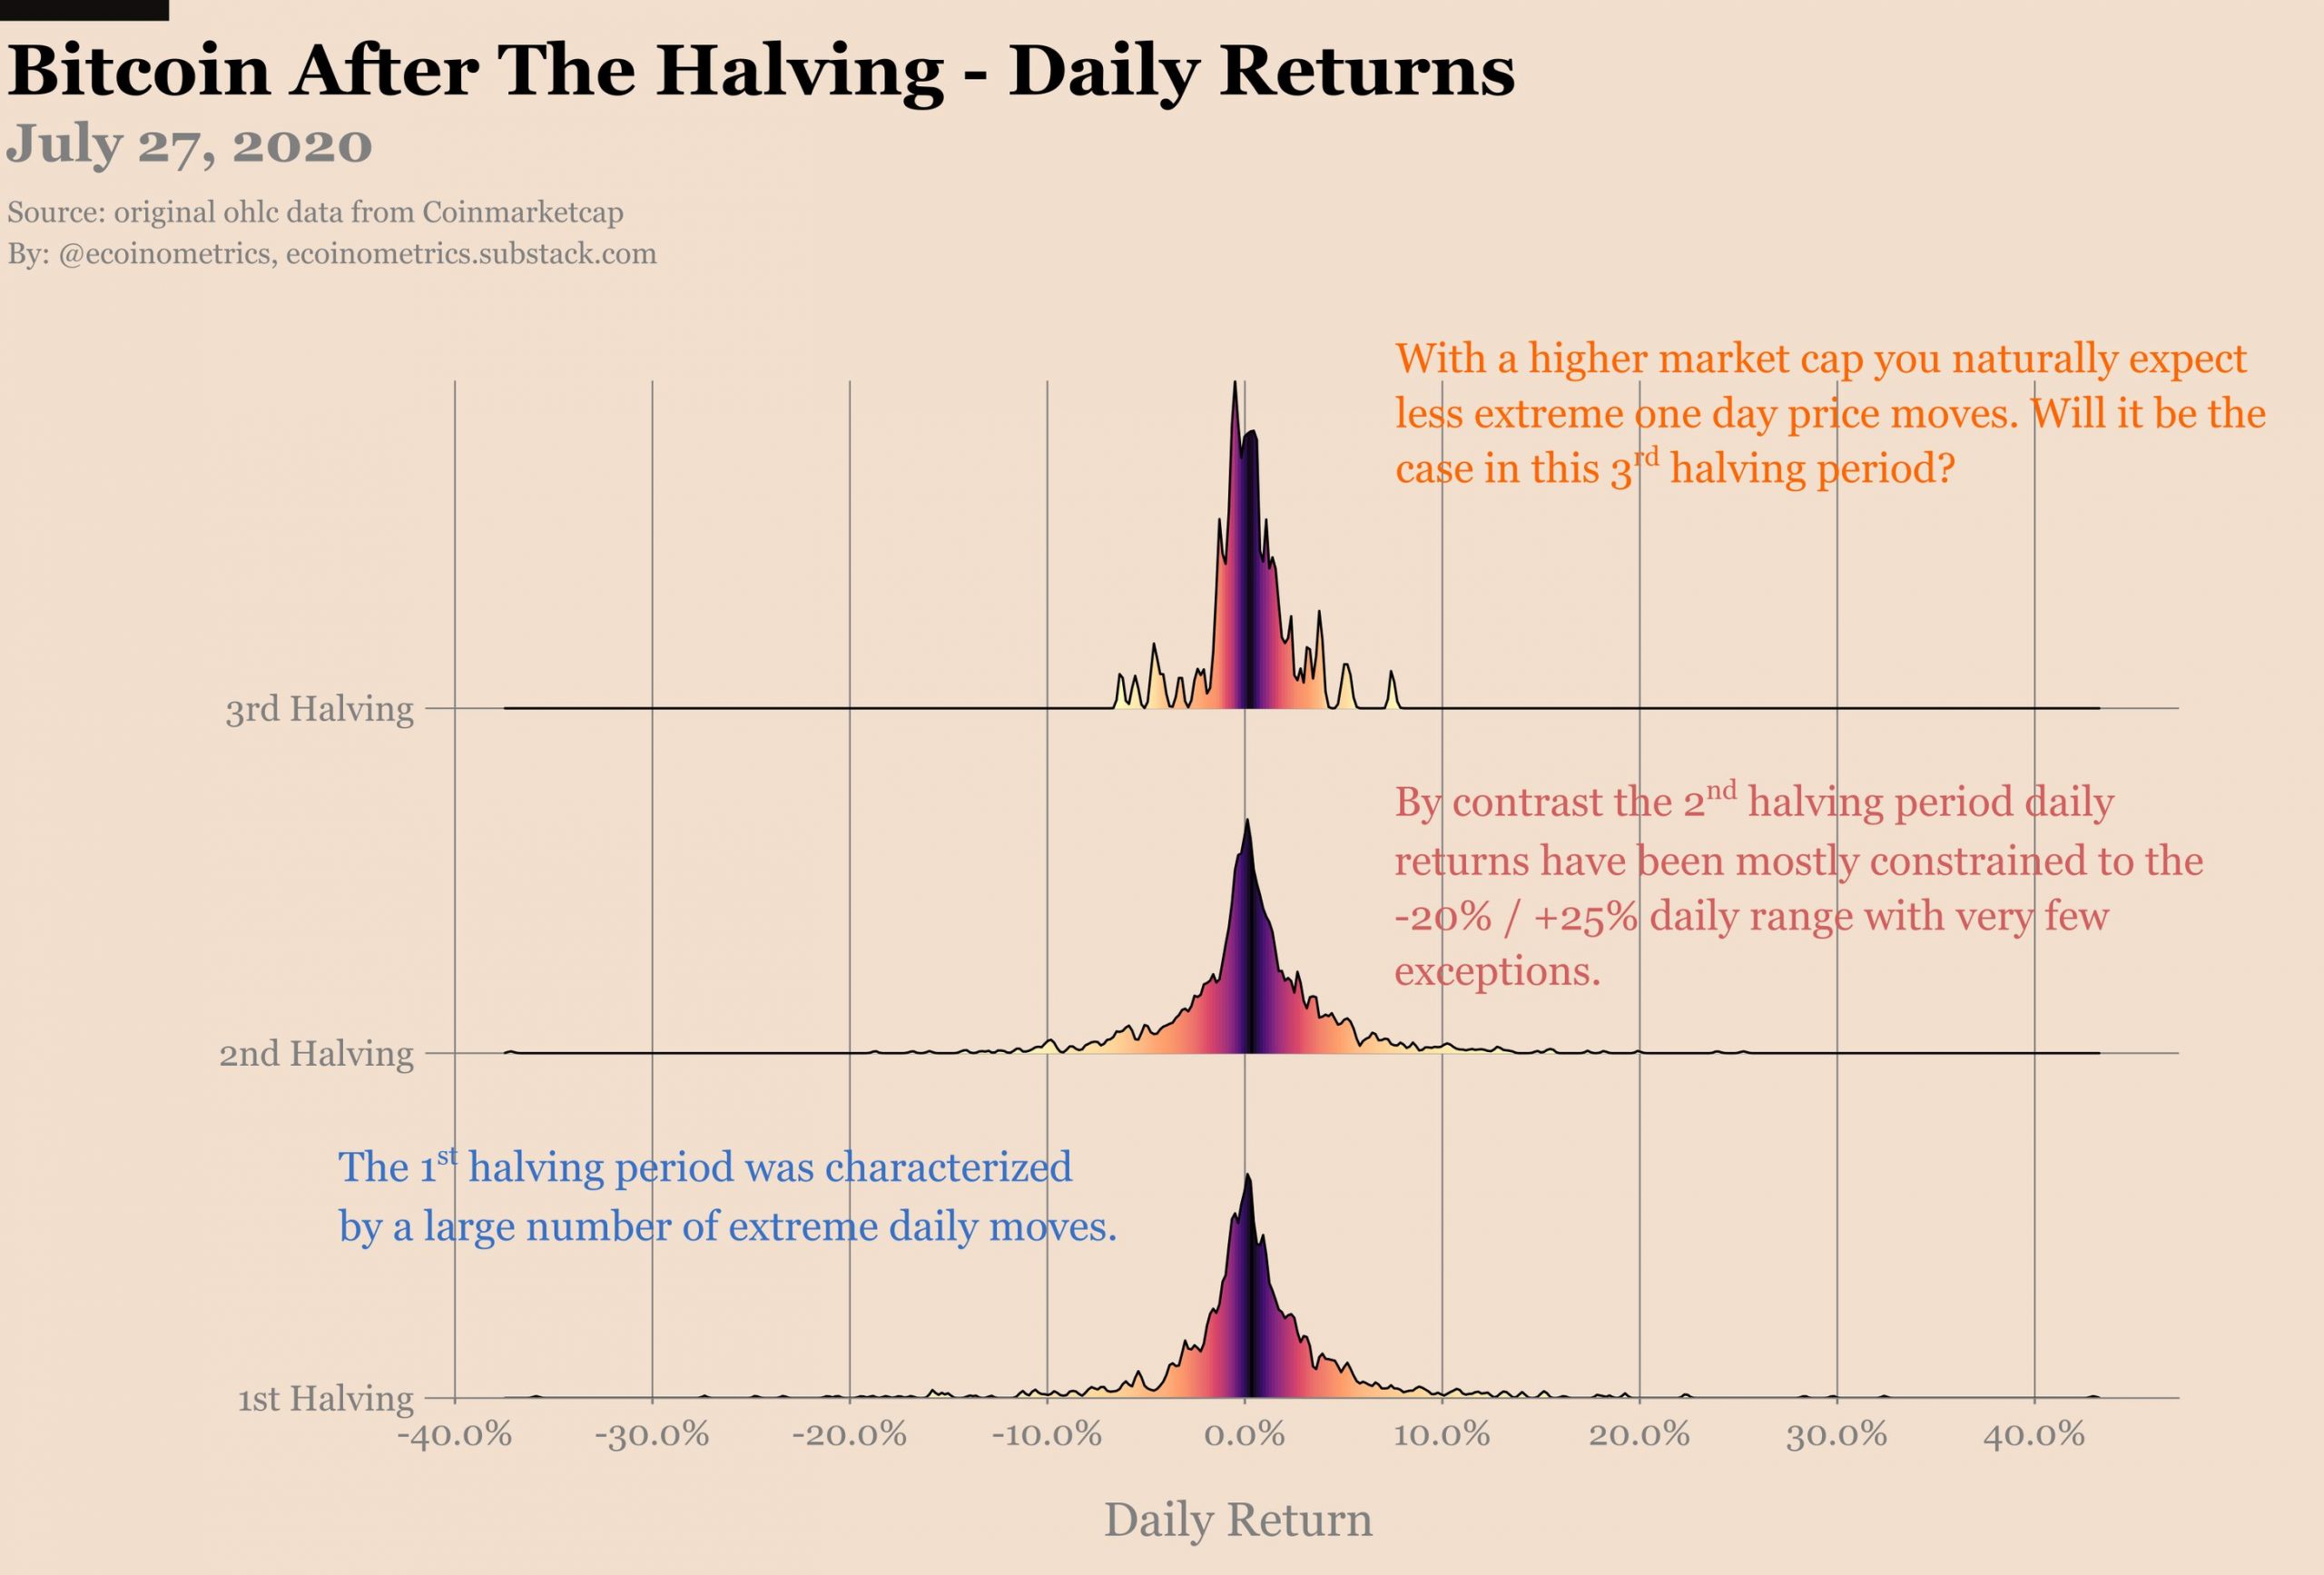
Bitcoin post-halving daily returns | Source: Ecoinmetrics
As can be seen in the graph above, the daily returns following Bitcoin’s third halving have been concentrated around 0, compared to the previous halving, where daily returns spread as far as 10 percent. Realized volatility during the 2012 halving and the 2016 halving was 65 percent and 70 percent respectively, while the current halving, even after taking into consideration the pump over the last two days, is not nearly at that level. Although the report argues, “a breakout might change that.”
If there’s one key takeaway difference between the previous halvings, its the volatility, so the question must be – What is driving down Bitcoin’s volatility, or rather, what can drive it down? The report suggests it could be the increasing market capitalisation. Although market cap is a derivative of the price of the asset, its distribution, less among whales and more among hodlers and investors alike, could rise to control volatility.
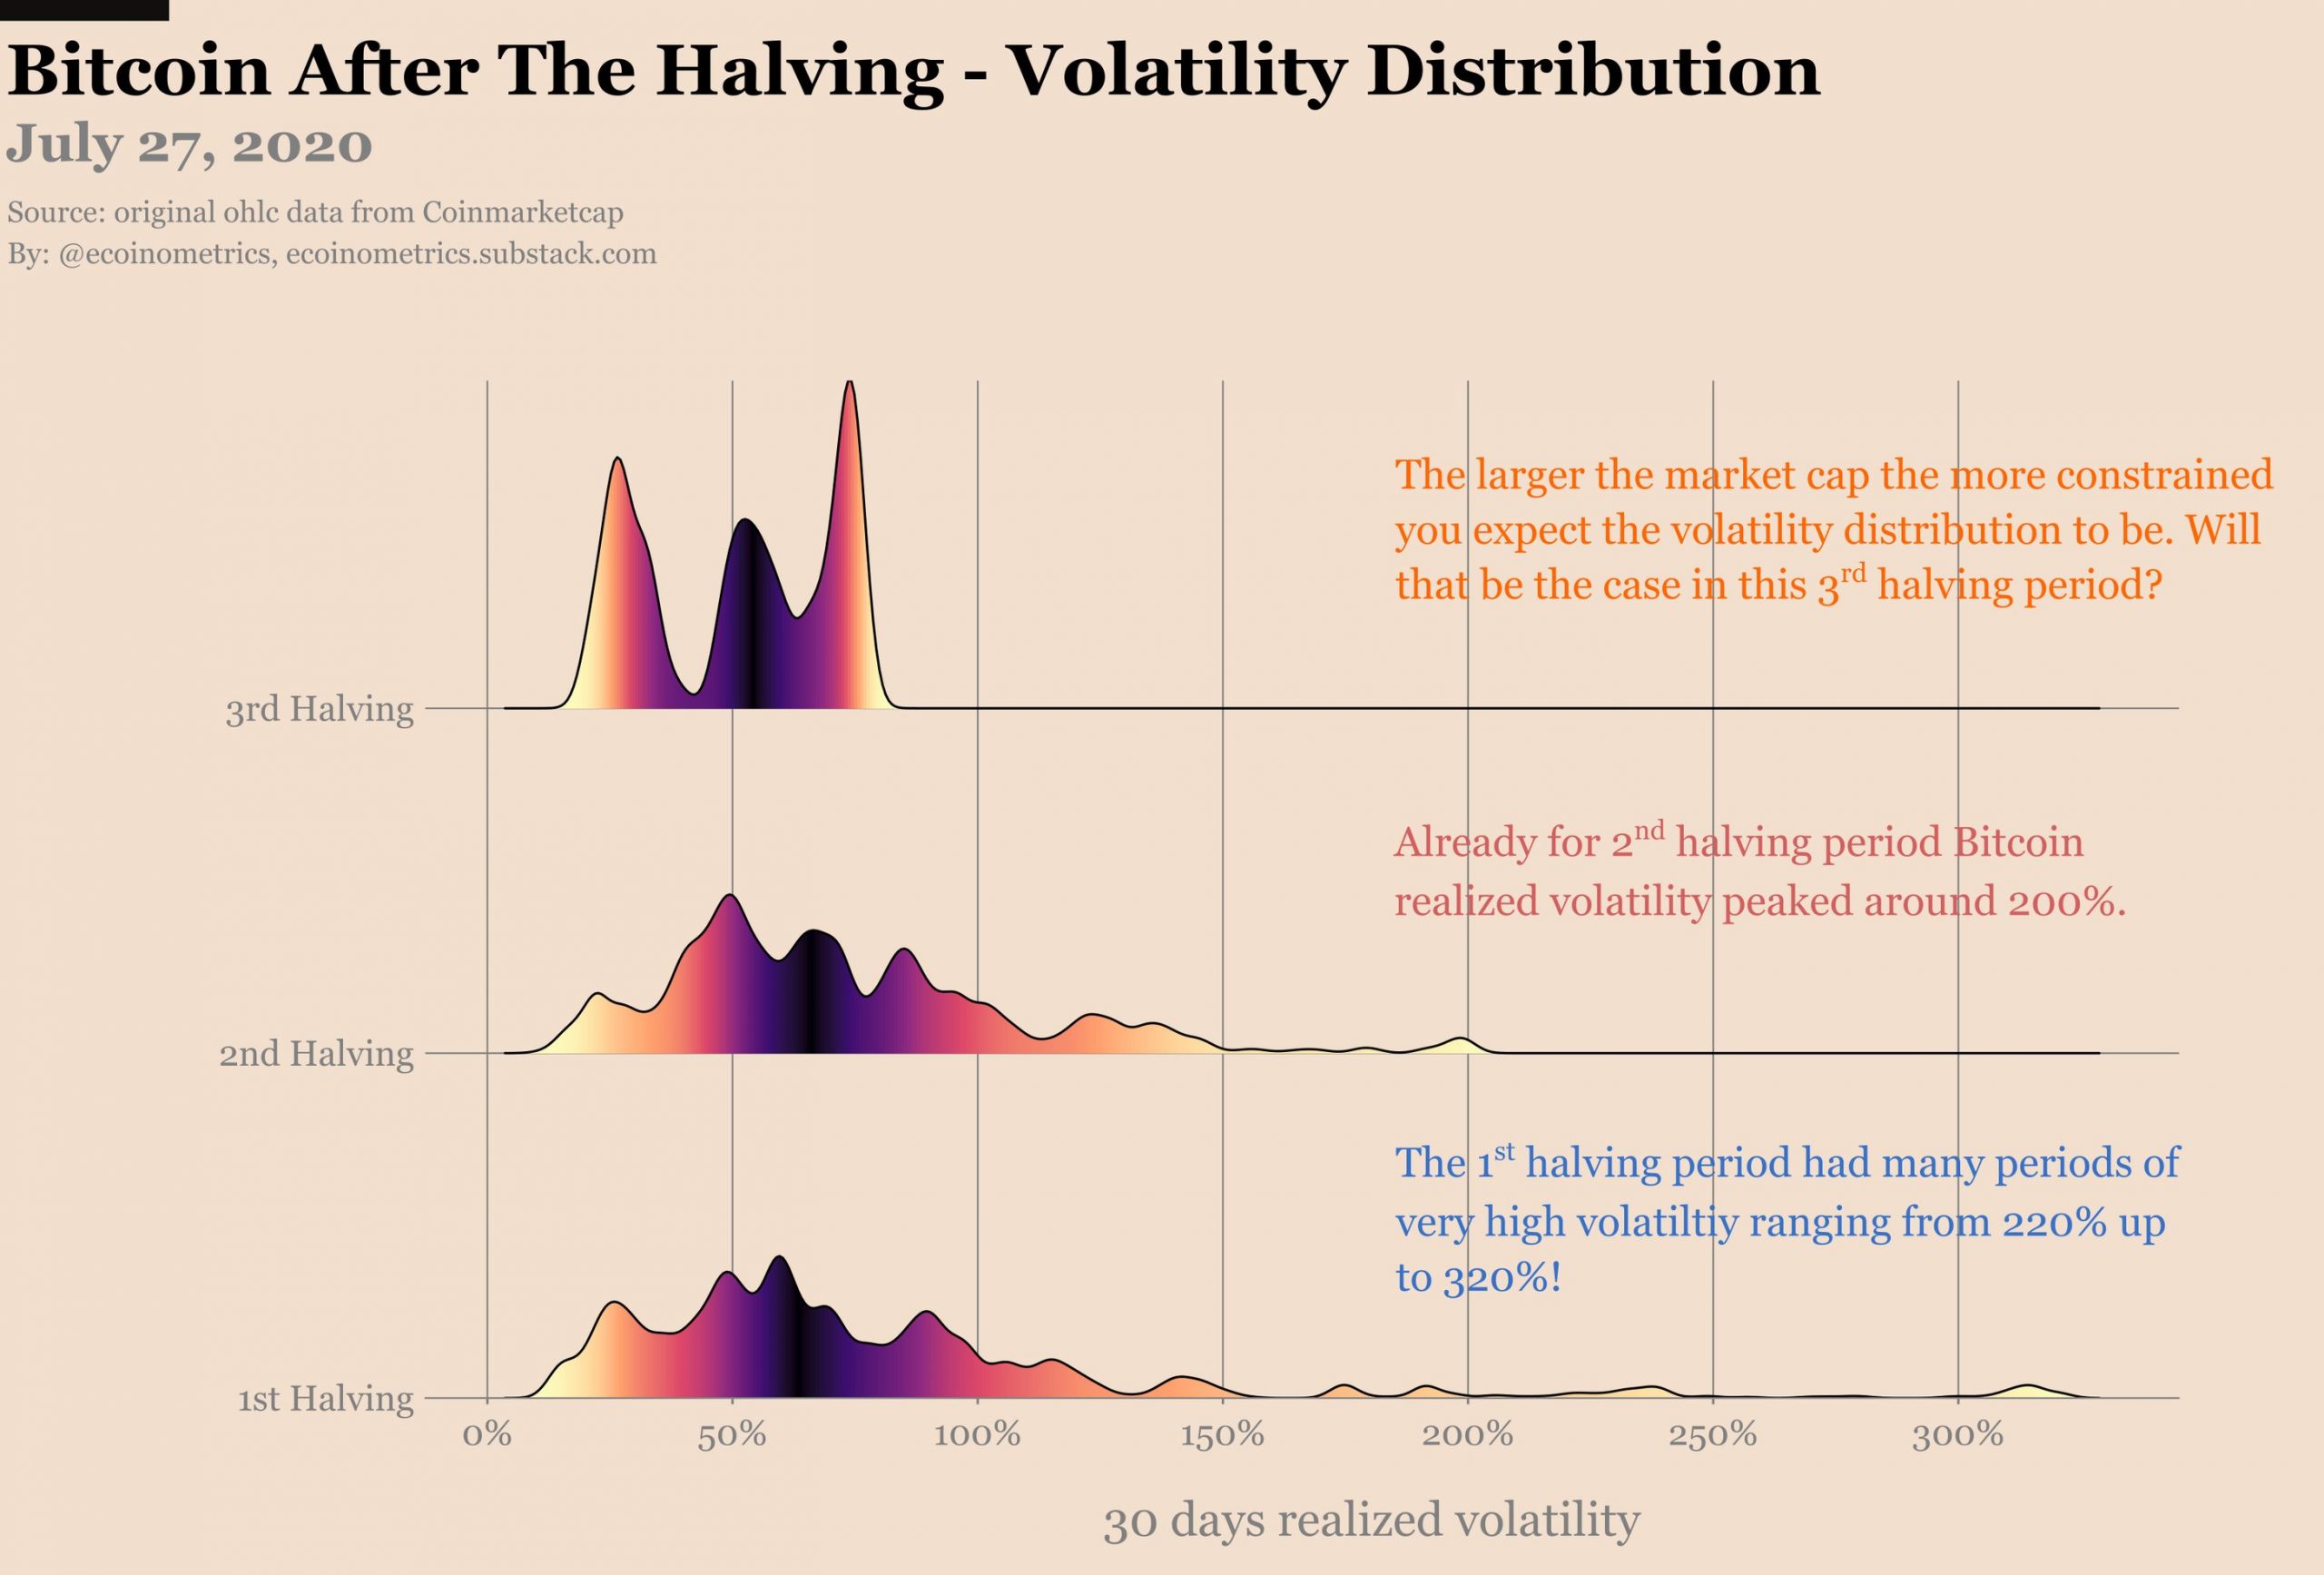
Bitcoin post-halving daily returns | Source: Ecoinmetrics
With Bitcoin’s current market cap is 20-times 2016’s value and 200-times 2012’s the case for Bitcoin’s rising market cap controlling volatility mid halvings is strong, but can this hold till 2024?