Analysis
Bitcoin’s breach of descending channel might provide brief respite to price
Bitcoin crashed by 7% in an hour on 23 October, following the liquidation of longs worth $201.1 million on BitMEX. The world’s largest cryptocurrency breached its immediate support at $7,885.82 and was valued at $7,451. At press time, the coin noted meager recovery and was valued at $7,465.06, with a market cap of $135.14 billion.
Despite the drastic drop in the coin’s price however, Bitcoin’s short-term charts suggest that the price may improve.
1-hour

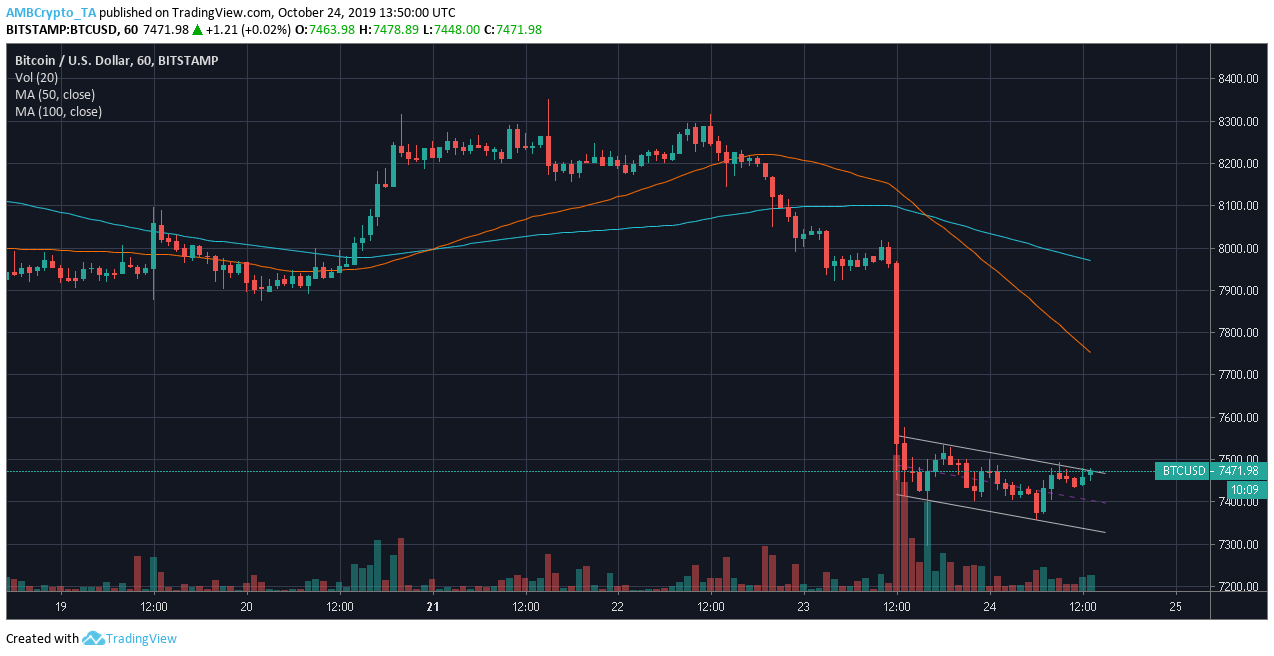
Source: BTC/USD on TradingView
The one-hour chart for Bitcoin noted the formation of a descending channel. The descending price of the coin was contained within two trend lines, one of which marked the lower highs of BTC at $7,551.91, $7535.35, and $7,476.23, and the other connected the lower lows at $7,414.73, $7,402.91, and $7,355.61. The volume resonated with the falling price and as it nears the breach of the pattern, Bitcoin might note a positive move.
The 50 moving average was under the 100 moving average, indicating a bearish trend. With the averages aligning above the candlesticks, the negative trend was noted to dominate the market.

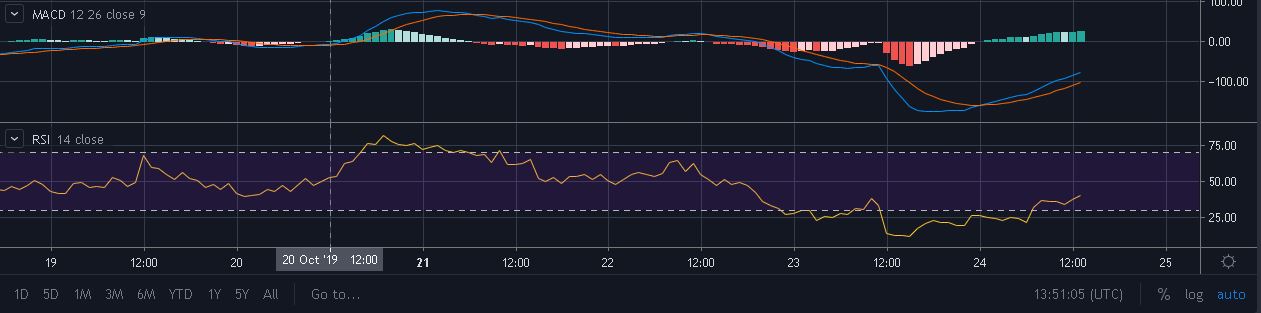
Source: BTC/USD on TradingView
The MACD indicator suggested a bullish trend. However, the momentum appeared to be weak. Thus, the bullish trend might be wiped out by the strong bears marching. The Relative Strength Indicator indicated that the signal line entered the equilibrium zone, but is still closer to the oversold zone.
Conclusion
Bitcoin’s price had been moving sideways with minimal change in price. With the bears asserting their dominance and descending channel making its way in the market, a drop in price might be imminent.


