Bitcoin: Will fractals drag BTC down to $5,500 or take it to $7,000?

Bitcoin suffered another drop of 10% after ‘Black Thursday‘. However, the drop was undone by today’s surge that pushed the price from $5,900 to $6,300. At press time, however, BTC was trading at $6,270.
Four Hour
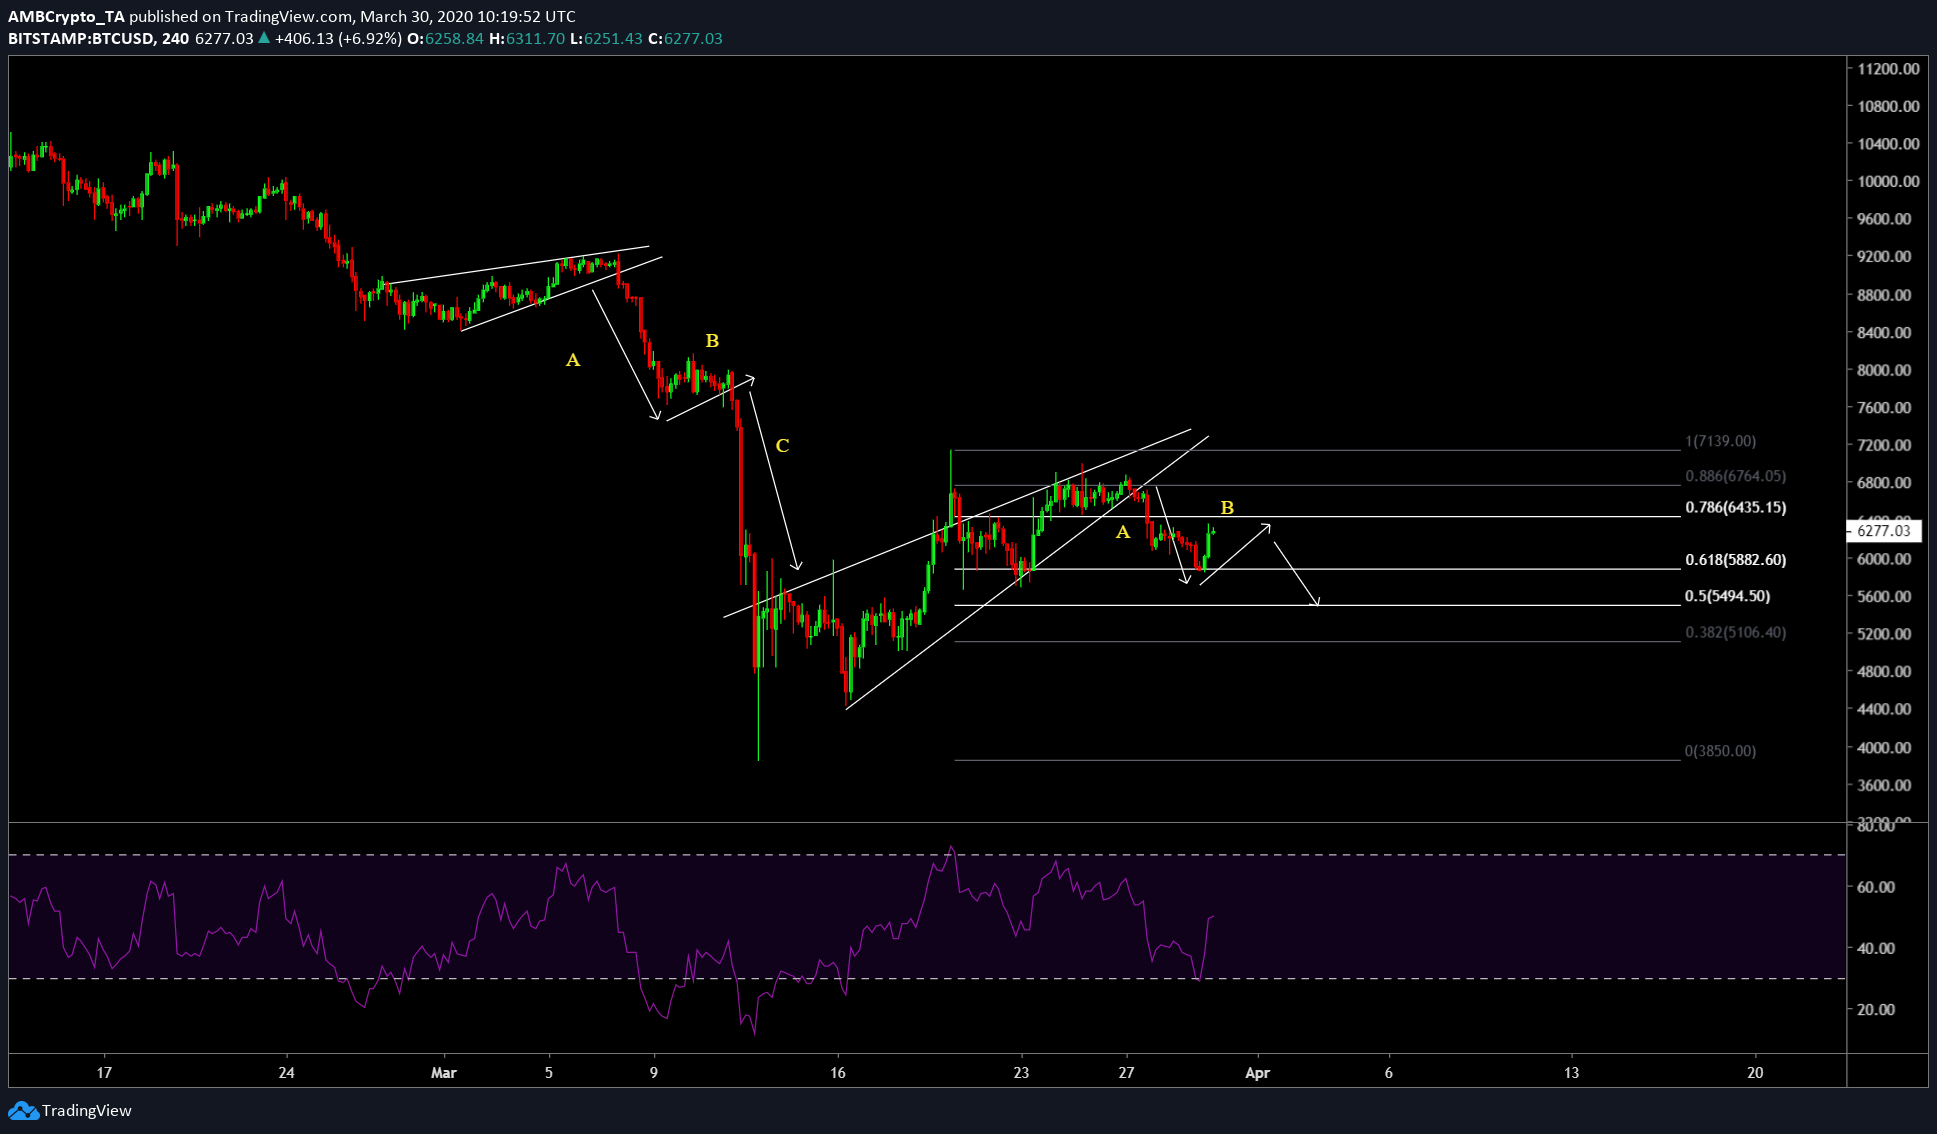
On the 4hr time frame, the price has since long broken out of the rising wedge mentioned earlier. At present, the rising wedge and the drop is similar to the drop seen in early March.

Source: BTCUSD TradingView
Both patterns contain a breakout of the rising wedge, followed by a sideways movement with a slight surge. The last step is important, as Bitcoin, at press time, still needs to develop this.
For now, the Relative Strength Index is showing a strong bounce from the oversold zone and this is translated onto the price, however, it is very close to hitting the overbought zone again. When RSI reaches this zone, hopefully, it will face an overhead resistance, pushing the price, either, sideways or down.
The overhead resistance falls at the 0.786-Fibonacci level aka $6,435. A subsequent bounce from there would push the price down to 0.618-Fibonacci level aka $6,882, or $5,900, where the price found support today, before pumping to $6,300. If the price, at press time, follows the previously formed pattern, then a drop is guaranteed. However, the extent of the drop depends solely on the bears.
Weekly
The weekly time frame for Bitcoin shows a rather bullish chart. The drop observed on ‘Black Thursday’ now connects to November 2017 lows forming a symmetrical triangle pattern. From the looks of it, on a macro scale, the only place for Bitcoin to go would be higher. However, considering the price, it will face two levels of resistance very close to each other.
The first [$6,515] was formed on November 24, 2019, and the second [$6,425] on December 16, 2019. A surge from here would be hindered by these two levels, if there isn’t enough bullish momentum.
Relative Strength Index showed a bounce from the oversold zone on the weekly time frame as well. Combining both scenarios, Bitcoin looks bullish on the shorter and the larger time frames.
Conclusion
Expect a drop to $5,500 if the fractal plays out. Regardless of the drop, Bitcoin’s price looks extremely bullish on the weekly time frame, making the overall scenario bullish. An extremely higher time frame target for Bitcoin would range from $8,000 to $9,000 in the next month and a half.


