
On 27 July 2020, Bitcoin surged by 11% in a single day, a surge that pushed its price from $9,933 to $11,417. This type of surge was last seen in April 2020, a time when BTC surged from $7,700 to $8,900, a 13% surge. However, since then, the price had been moving along with the barest of volatility.
Not only did this surge bring back the excitement that was long gone from the BTC ecosystem, but it also contributed to the liquidation of $130 million worth of short positions. Hence, it is important to understand where BTC is headed so that one can be better positioned for the cryptocurrency’s upcoming moves.
Two charts, weekly and monthly, show the significance of a few levels, both of which need to be achieved to keep the present bullish momentum going. Apart from the aforementioned charts, the CME gap is also staring down the buyers, waiting to push them down.
Weekly chart
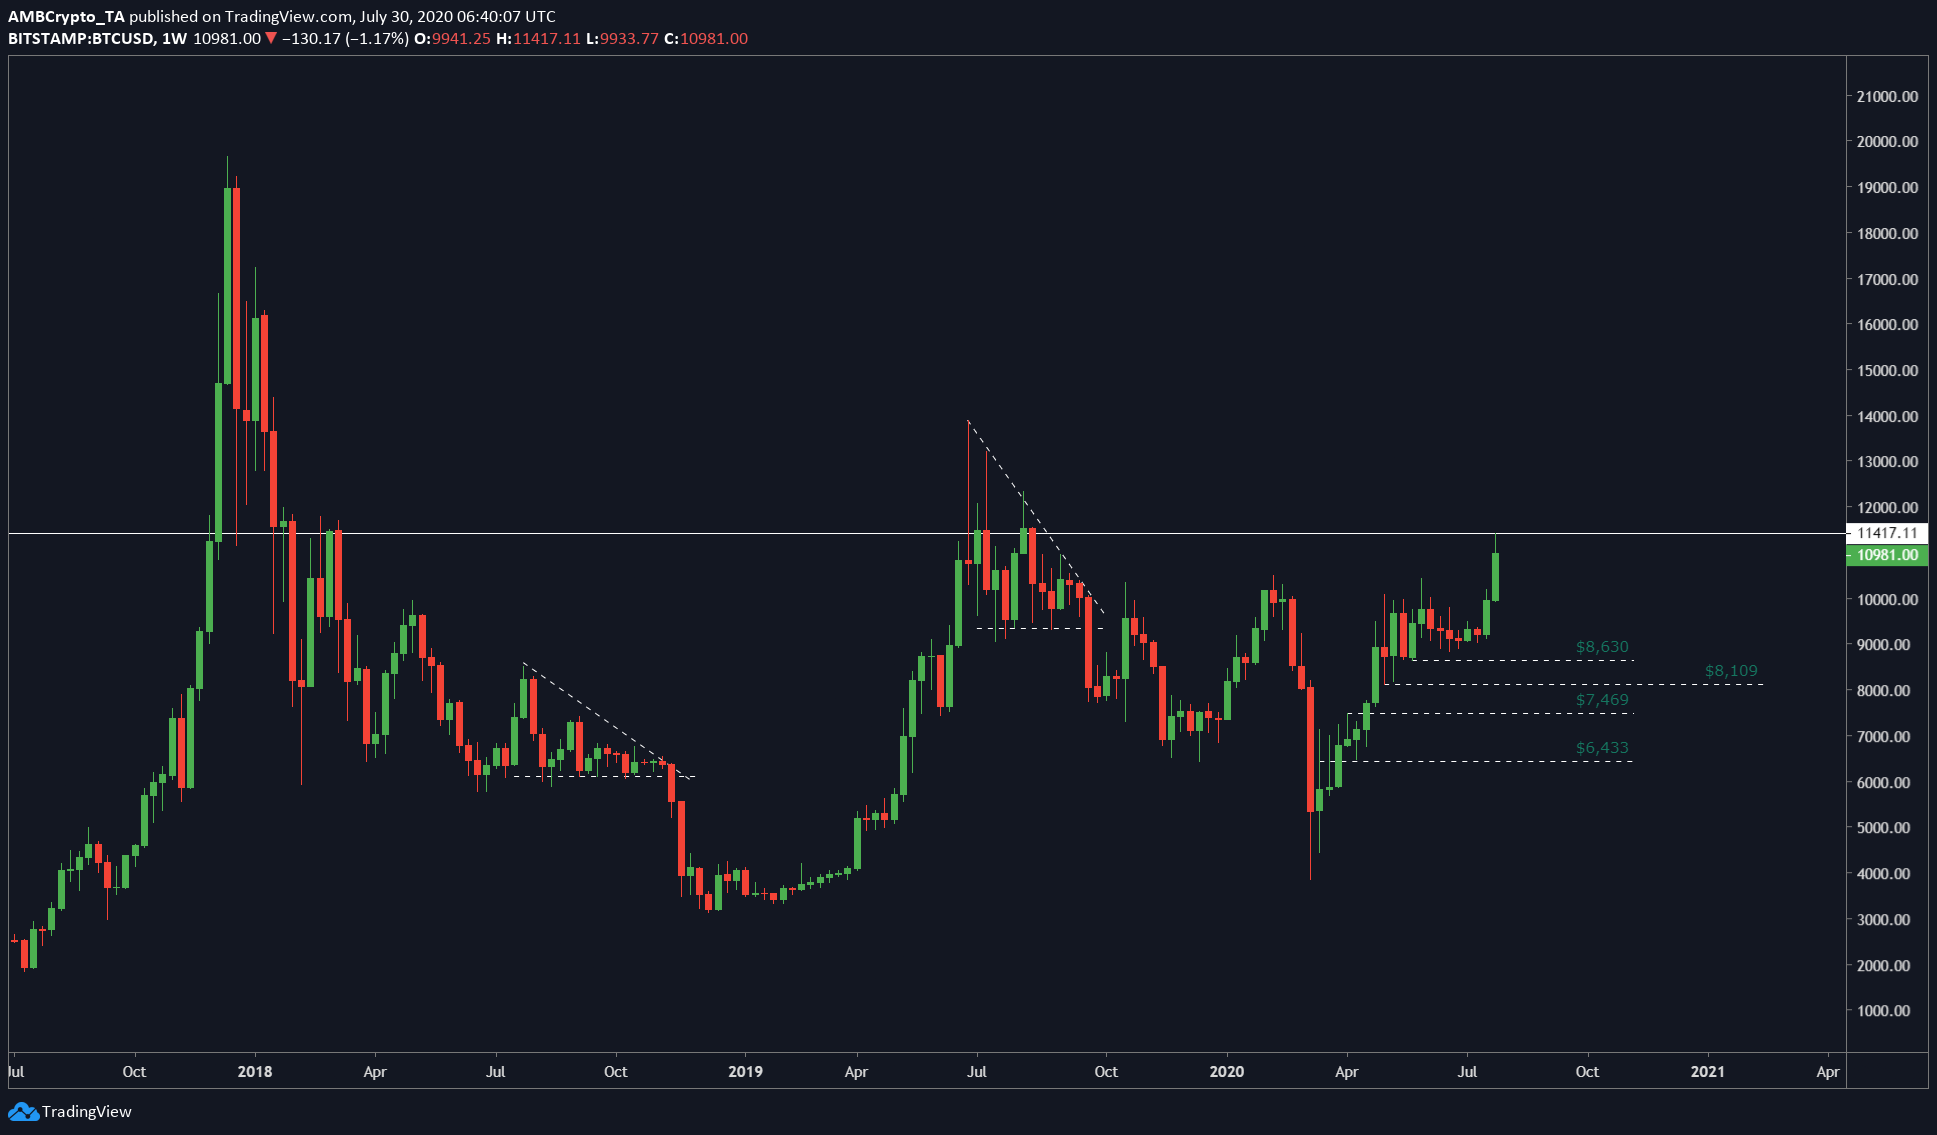
Source: BTCUSD on TradingView
The chart attached above shows resistance at $11,417, the level last seen almost a year ago. Additionally, the weekly candle has 3 more days to go, hence, a close above $11,500 would be extremely bullish for Bitcoin. Either way, a more conservative approach would be if BTC closed above $10,500. This would mean that more bullish moves are yet to come for the cryptocurrency.
However, a close below $10,500 would mean a downtrend towards $10,100 and $9,900. Hence, a retracement would be logical should BTC fail to climb above $10,500.
Monthly chart
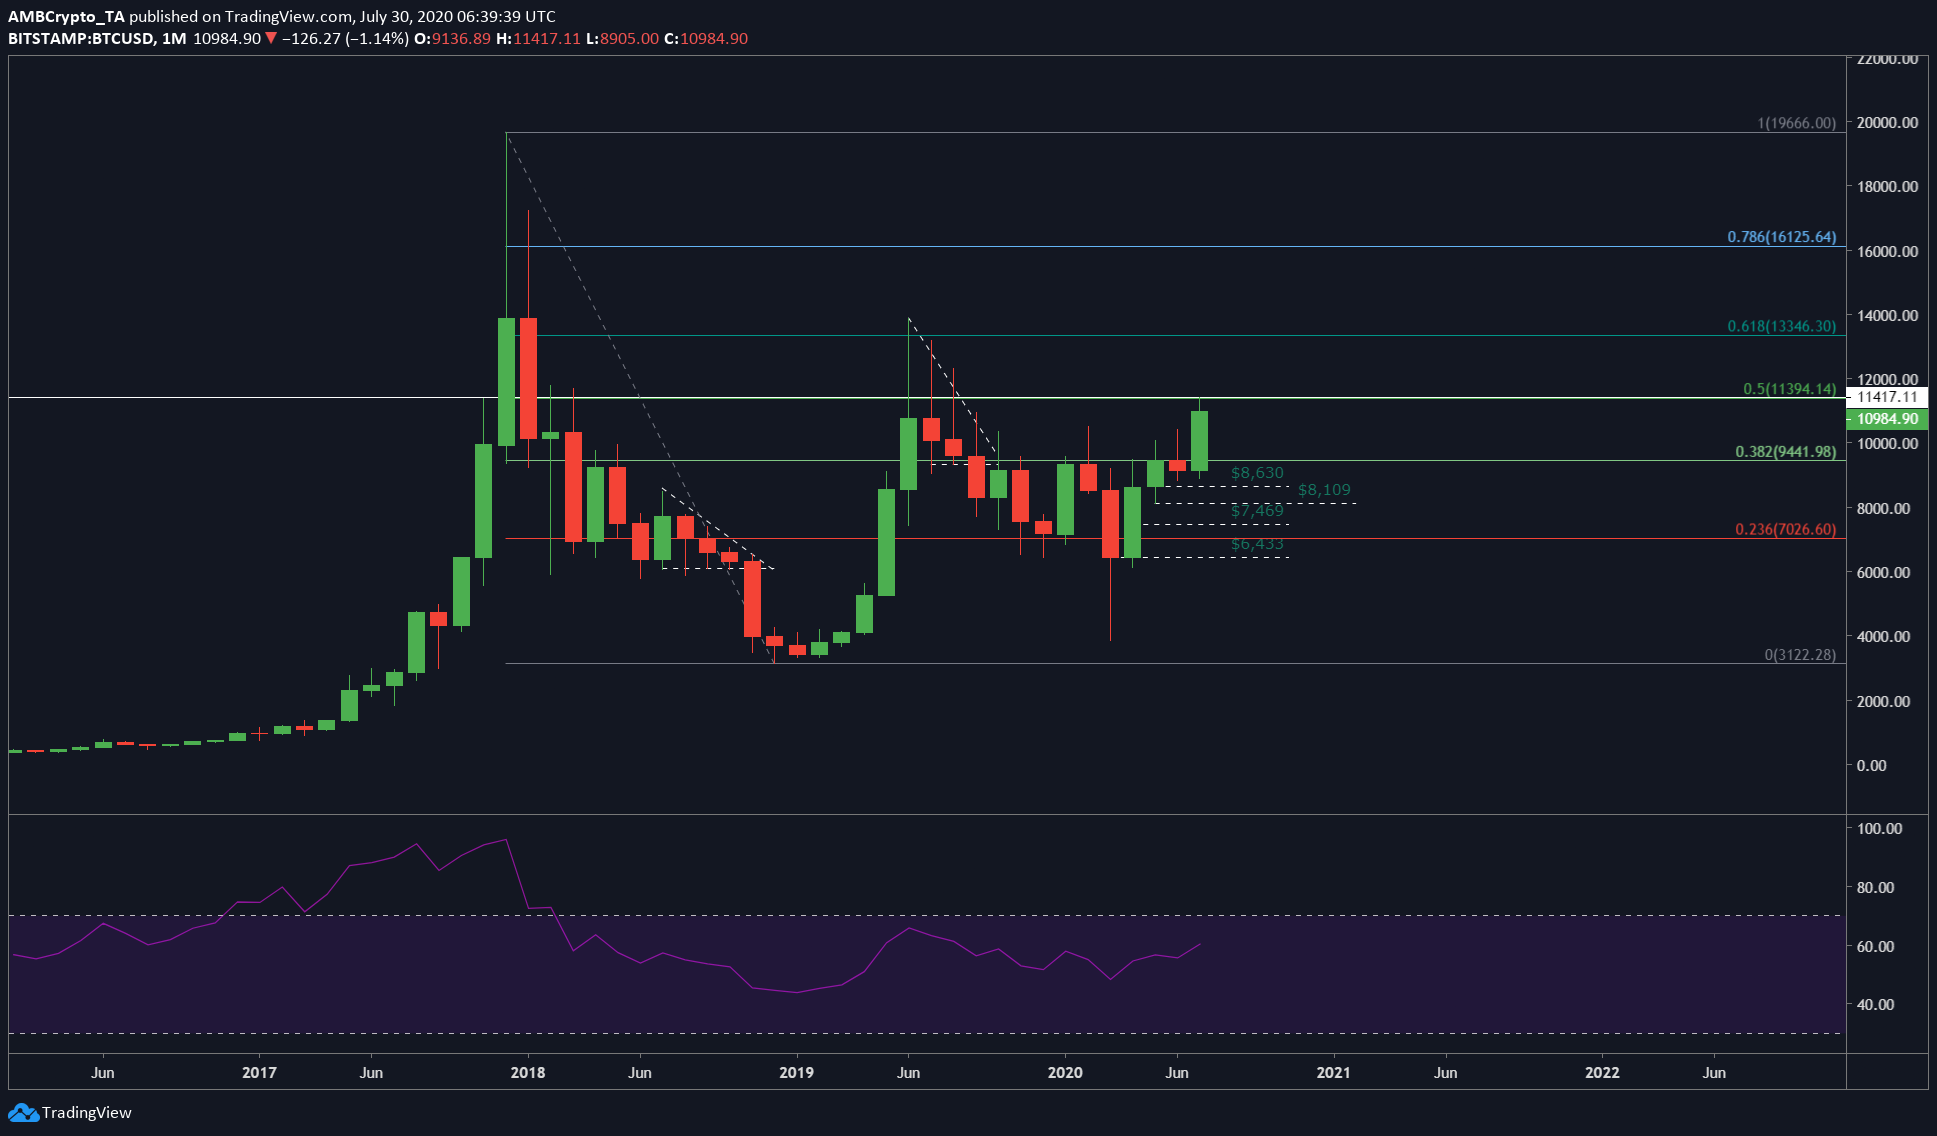
Source: BTCUSD TradingView
From the monthly chart, the significance of the resistance at $11,471 can be seen. A close higher than this level would absolutely confirm the bullish momentum. However, what is interesting is the overlap of the 0.5 Fibonacci level and the $11,417 level. This level would be a considerably tougher target to achieve. Closing higher would mean two targets – $13,200 and $16,100.
Will we reach the levels?
Bullish as it seems, Bitcoin might not achieve them just yet. A retracement seems more likely if the aforementioned resistance levels are not breached. Supporting this scenario is the CME gap which has formed from $9,925 to $9,645.
Gaps are formed in CME BTC Futures since the markets are closed on weekends. However, an interesting theory is that Bitcoin tends to fill these gaps up as the markets open. Although there isn’t a proven reason behind this phenomenon, the following two can be assumed true,
a. Removal of temporary market inefficiency.
b. Self fulfilling prophecy— Mohit Sorout ? (@singhsoro) July 28, 2020
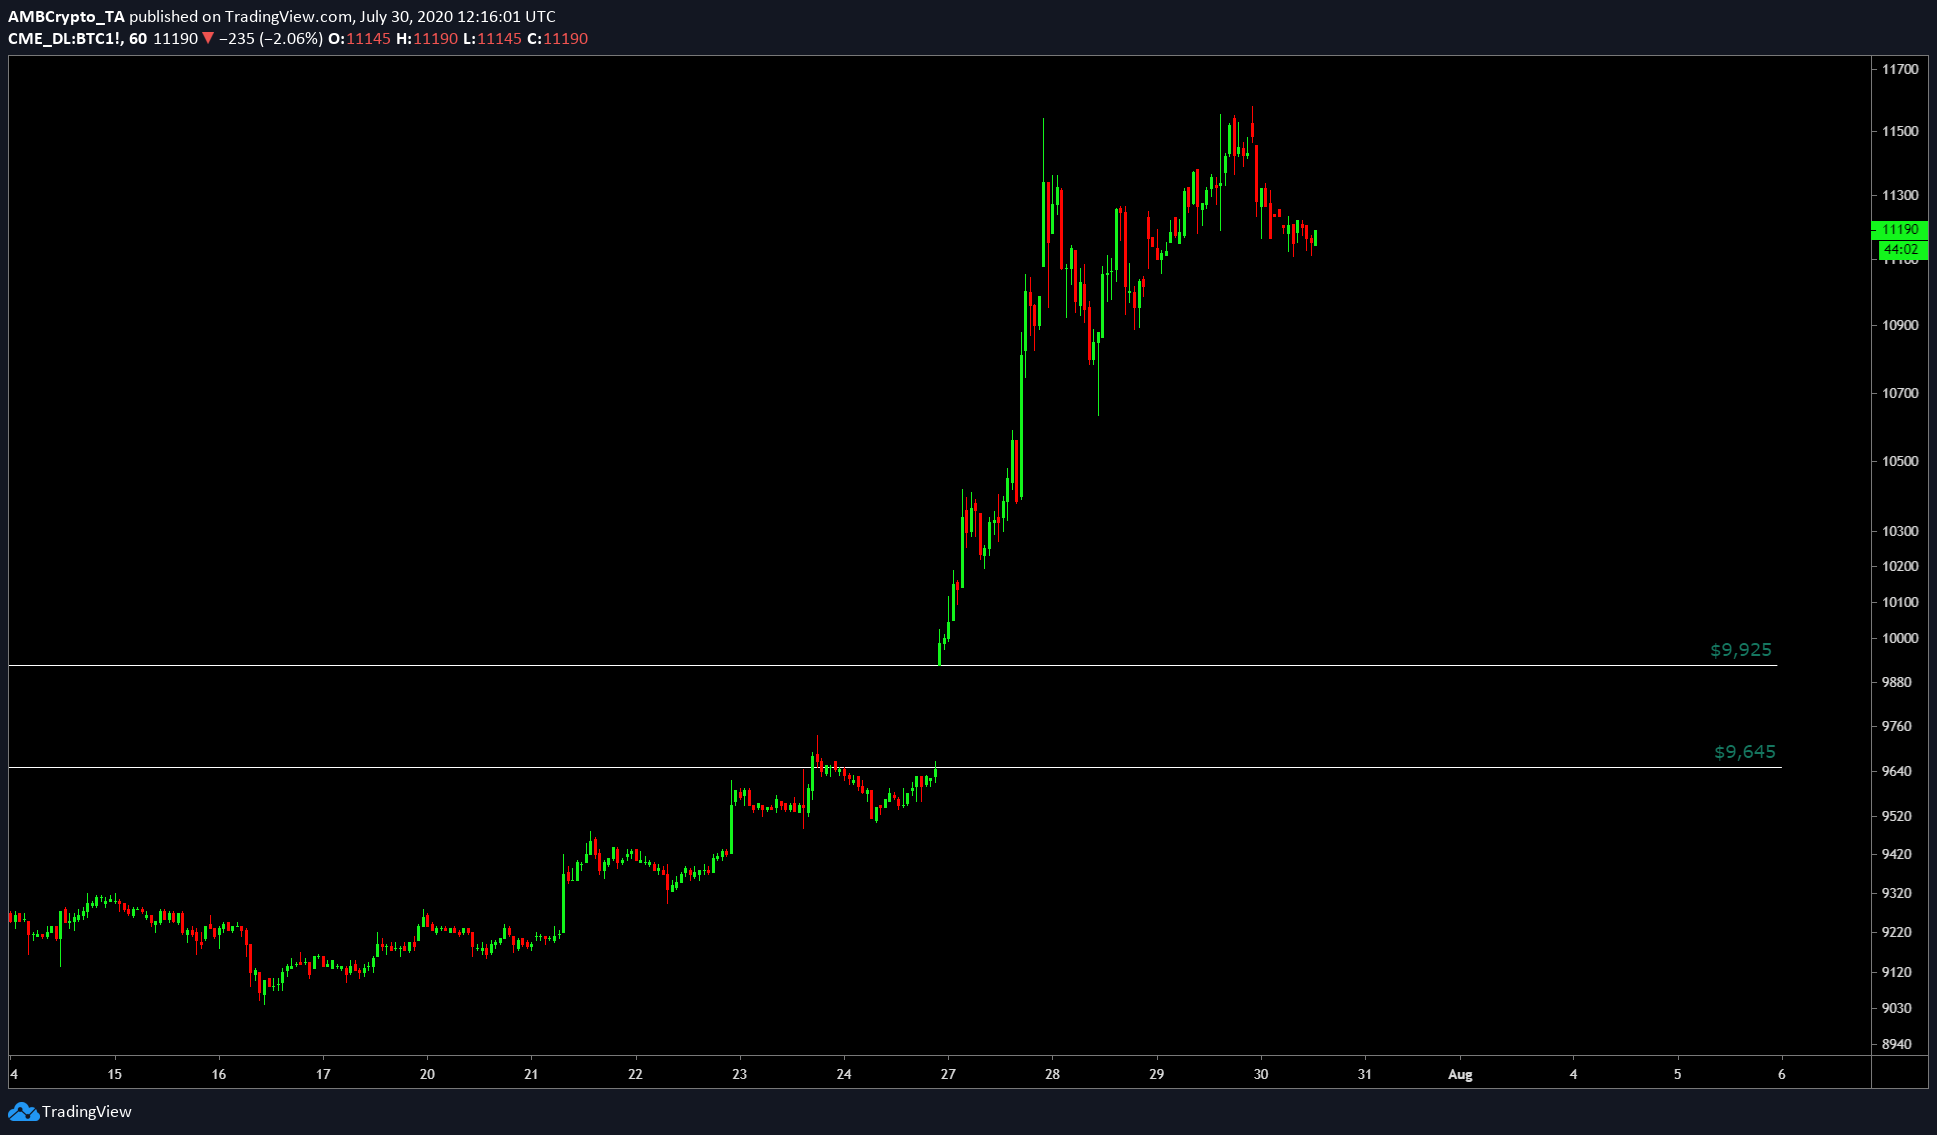
Source: BTCUSD TradingView
With the strong resistance levels at $11,417, the 0.5-Fibonacci level, and the CME gaps, it makes sense for BTC to retrace here to $9,900 and perhaps lower, before continuing its journey north.


