Bitcoin SV short-term Price Analysis: 27 November

Disclaimer: The findings of the following article are the sole opinion of the writer and should not be taken as investment advice
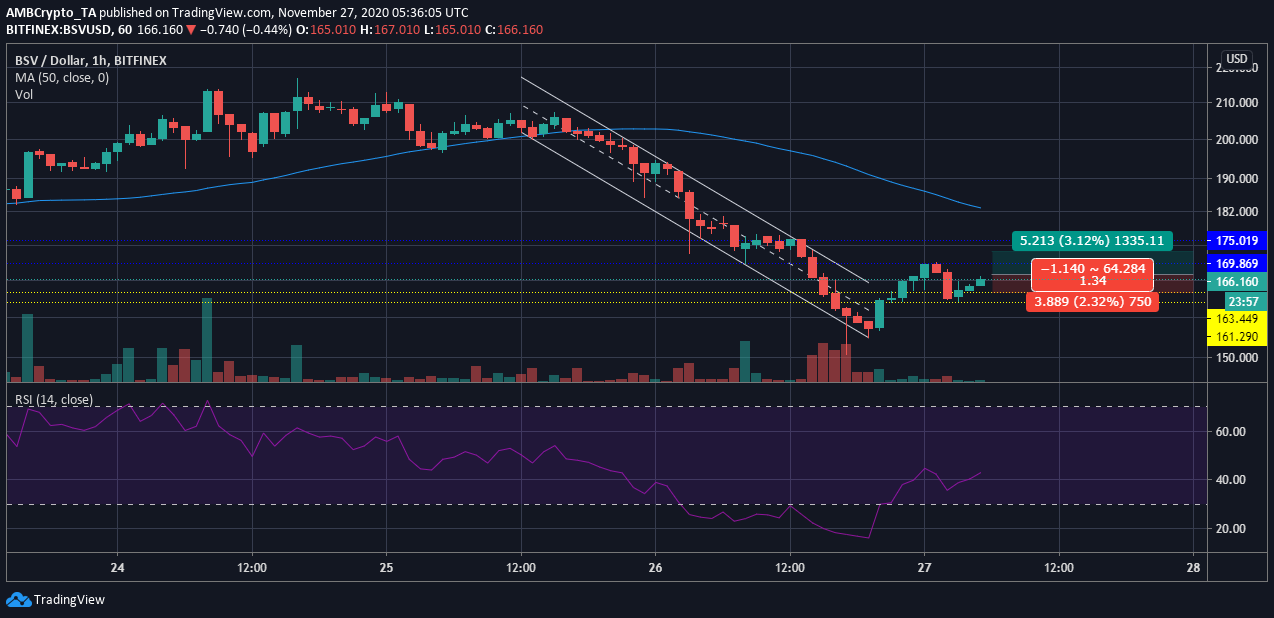
As the value of Bitcoin faces hurdles in the market, many altcoins have also been falling on the charts. Bitcoin SV has been noting a strong devaluation and at press time, after a brief recovery effort, it was being traded at $166.16. Although the overall sentiment in the market appeared bearish, there could be a benefit in taking a long position in the short-term.
Bitcoin SV 1-hour chart

Source: BSV/USD on TradingView
The above one-hour chart of Bitcoin SV highlighted a downtrend within a descending channel. The asset was valued at $207 before it started trending lower and it sunk as low as $150. However, the price has managed to bounce back up, and currently looks like there could be a bigger recovery in the market and long positions could be realized.
Reasoning
The Relative Strength Index indicated that the sudden price drop had pushed the asset into the oversold zone. After dropping further in the oversold zone, there was finally a recovery set in motion and the coin has come out of the oversold zone.
As BSVmoves towards equilibrium, the price of the digital asset may also increase in the short-term. Since the resistance is marked at $169.89, and the support remained at $163, there could be a marginal increase in its value.
Positions
Entry for a Long position: $167.30
Take Profit: $172.513
Stop Loss: $163.41
Risk/Reward Ratio: 1.34
Conclusion
Even though bearishness prevails in the BSV market, there could be minimal recoveries noted to balance out the selling pressure in the market. The price of the asset may further consolidate in the short term given the immediate resistances and supports marked close at this level.
