Analysis
Bitcoin SV short-term price analysis: 15 June

Disclaimer: This article attempts to analyze Bitcoin SV’s price movement on the 15th of June.
Bitcoin SV has had an impressive streak climbing all the way to $419 in the first few of 2020. At a time when most of the altcoins have or are close to recuperating from the losses incurred in the Black Thursday crash of March, BSV, on the hand, has gone south. At the time of writing, BSV was being traded at $170.07 and was down by nearly 7 percent over the last 24-hour following the latest market correction.
Bitcoin SV Daily Chart:

Source: BSV/USD on TradingView
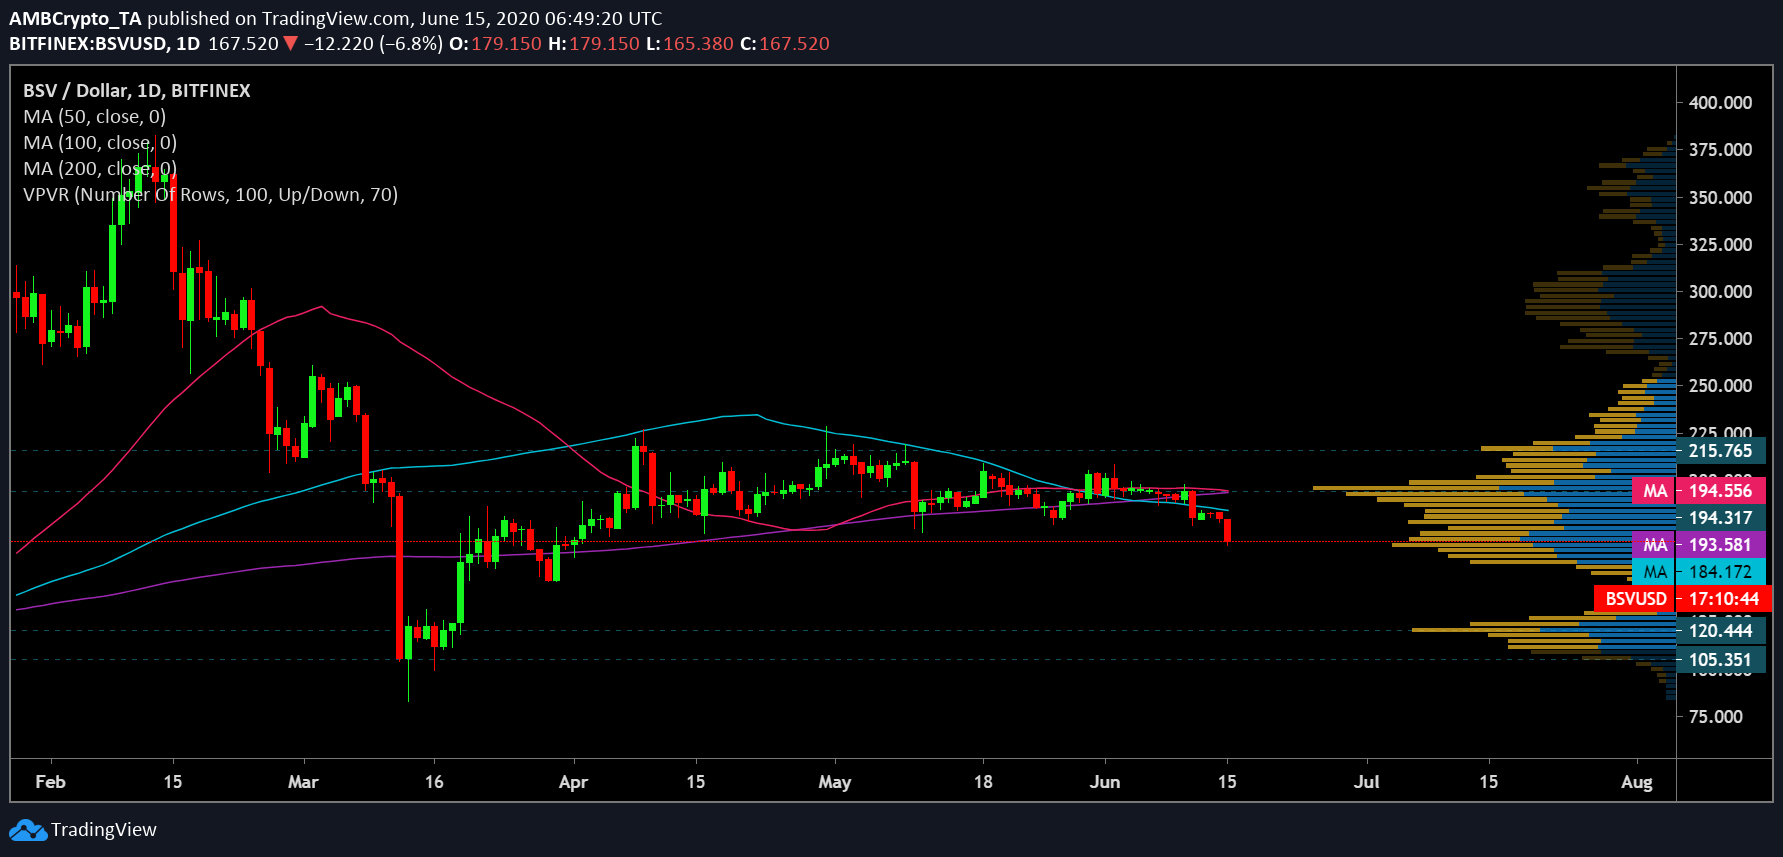
Despite climbing all the way to positioning itself as the 6th-largest cryptocurrency by market cap, lately, Bitcoin SV has failed to post any substantial rally that could catapult its price to previously breached points. While upward momentum has been weak, BSV downside corrections have been dominant. The above daily chart depicted that the bears continued to reign over the BSV’s price as a prospect of a positive breakout in the near-term was not in sight. This was further validated by the placement of the daily moving averages.
At the time of writing, the 5o DMA [Pink] continued to appeared to undergo a death cross with the 200 DMA [Purple]. Also, the 100 DMA [Blue] moved below the 200 DMA, thus sustaining a bearish crossover. In addition, the BSV price candles have slid below all the daily moving averages, further depicting the bearishness in the BSV market.
Source: BSV/USD on TradingView
The RSI was also well below the 50-median neutral line and pointed towards a sentiment of high sell pressure among the investors in the coin market.
Historically, being a fork of the king coin, Bitcoin SV has closely mimicked the price action of the former. This was also evident in the latest price action where Bitcoin’s dip propelled a major swing on the downside for the fork coin. This essentially implied that Bitcoin SV requires a significant boost from Bitcoin’s upward price action to recover from all the losses over the past couple of weeks.
The above charts depicted a potential downturn for BSV with an increasing chance of high sell-off concerns as the coin’s upward price action was resisted by all the moving averages. A bearish phase for the coin could potentially drive its price all the way to $120.4. If this trend persists, BSV could also retrace to another support level at $105.3. The coin’s immediate resistances stood close to the crossover of the 50 and the 200 DMA at $194.5 while another point of resistance stood unbreached at $215.7 as depicted by the VPVR indicator.

