Analysis
Bitcoin SV short-term price analysis: July 06

Bitcoin SV, at press time, stood just below Bitcoin Cash, at the sixth position. While Bitcoin Cash, its competitor, holds the position at 5th, BSV’s market cap is half of BCH at $2.85 billion. The coin has seen a 0.55% drop in the last 24 hours and by the looks of it, more is yet to come.
Bitcoin SV Four-Hour Chart

BSVUSD TradingView
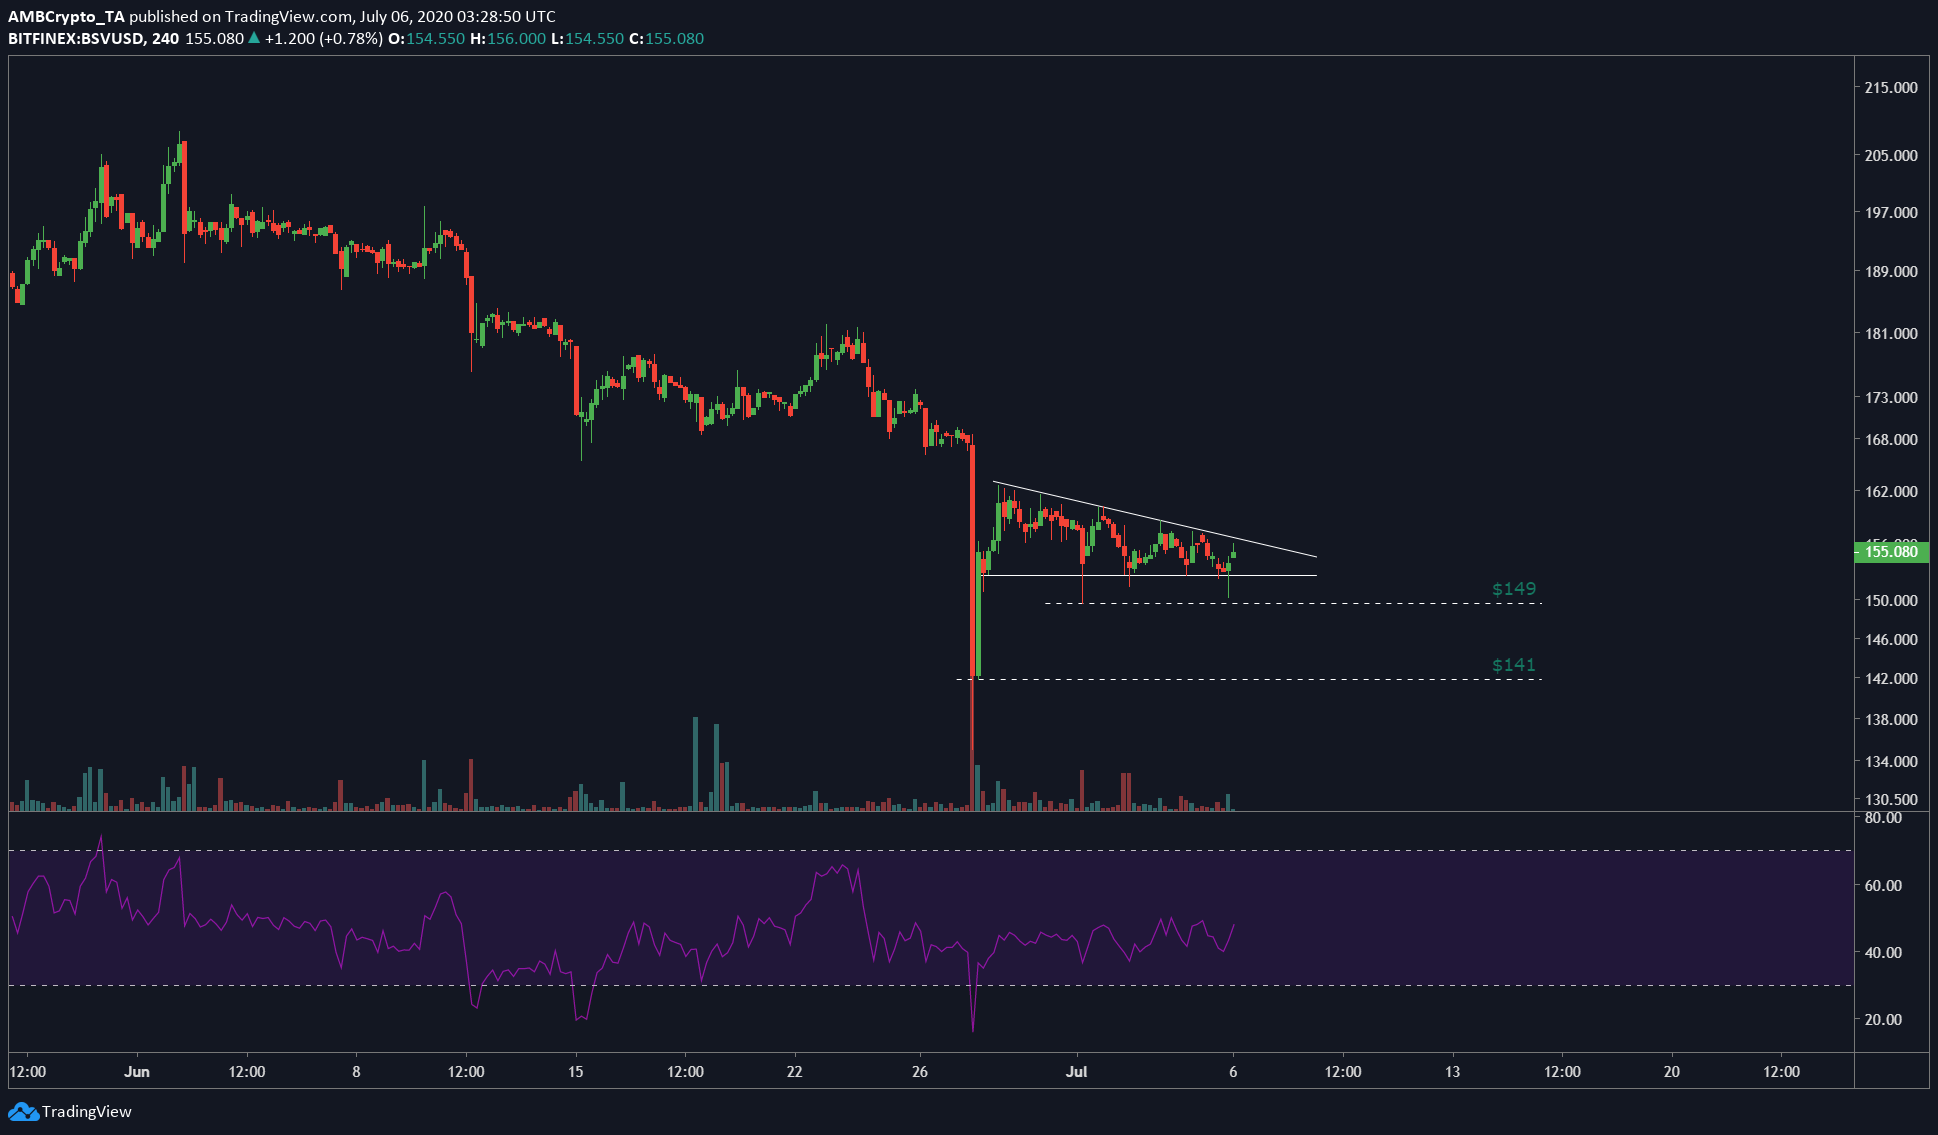
The price of BSV has been consolidating since the drop witnessed on June 26. The price has formed a descending triangle as seen above, which has a bearish bias. RSI, which is at 50-level, might surge higher causing the price to hit and even breach the upper line of the pattern.
Hence, it could push the price to $162, following which, RSI might hit the overbought and then proceed to break out below as expected. The second possibility is that the price breaks out to the downside. Here, the price will hit immediate support at $149, which is a 3.69% drop from the current price level. Breaching this level could push the price to $141, which is a 8.59% drop from the current level.
BSV Daily
BSVUSD TradingView
The daily time frame for BSV is needed to understand how the short-term price will affect long-term narrative of the coin. As mentioned above, $141 level is a significant one, and a downside breakout would mean a price target of $135. The last time price entered this level was on June 27. RSI on the daily time frame was close to the oversold level and a further breakdown would see a scenario like the March crash. Additionally, the golden cross formed during its rally in February has now formed a death cross signifying the bearishness of the situation.

