
Disclaimer: The conclusions of the following analysis are foreseeable until the first week of July
Bitcoin SV has been on a mission to recover all of its losses since the Black Thursday crash. During the course of the past few months, Bitcoin SV has managed to momentarily go past the March 12 price point. However, the coin has been quite quick to retrace its steps and is currently once again trying to turn its fortune for the better and register a 100 percent recovery.
At press time, Bitcoin SV was being traded at $172 and had a market cap of $3.2 billion. Over the past 24 hours, BSV’s price endured a drop of 1.6 percent, having registered a trading volume of $957 million.
1-day chart
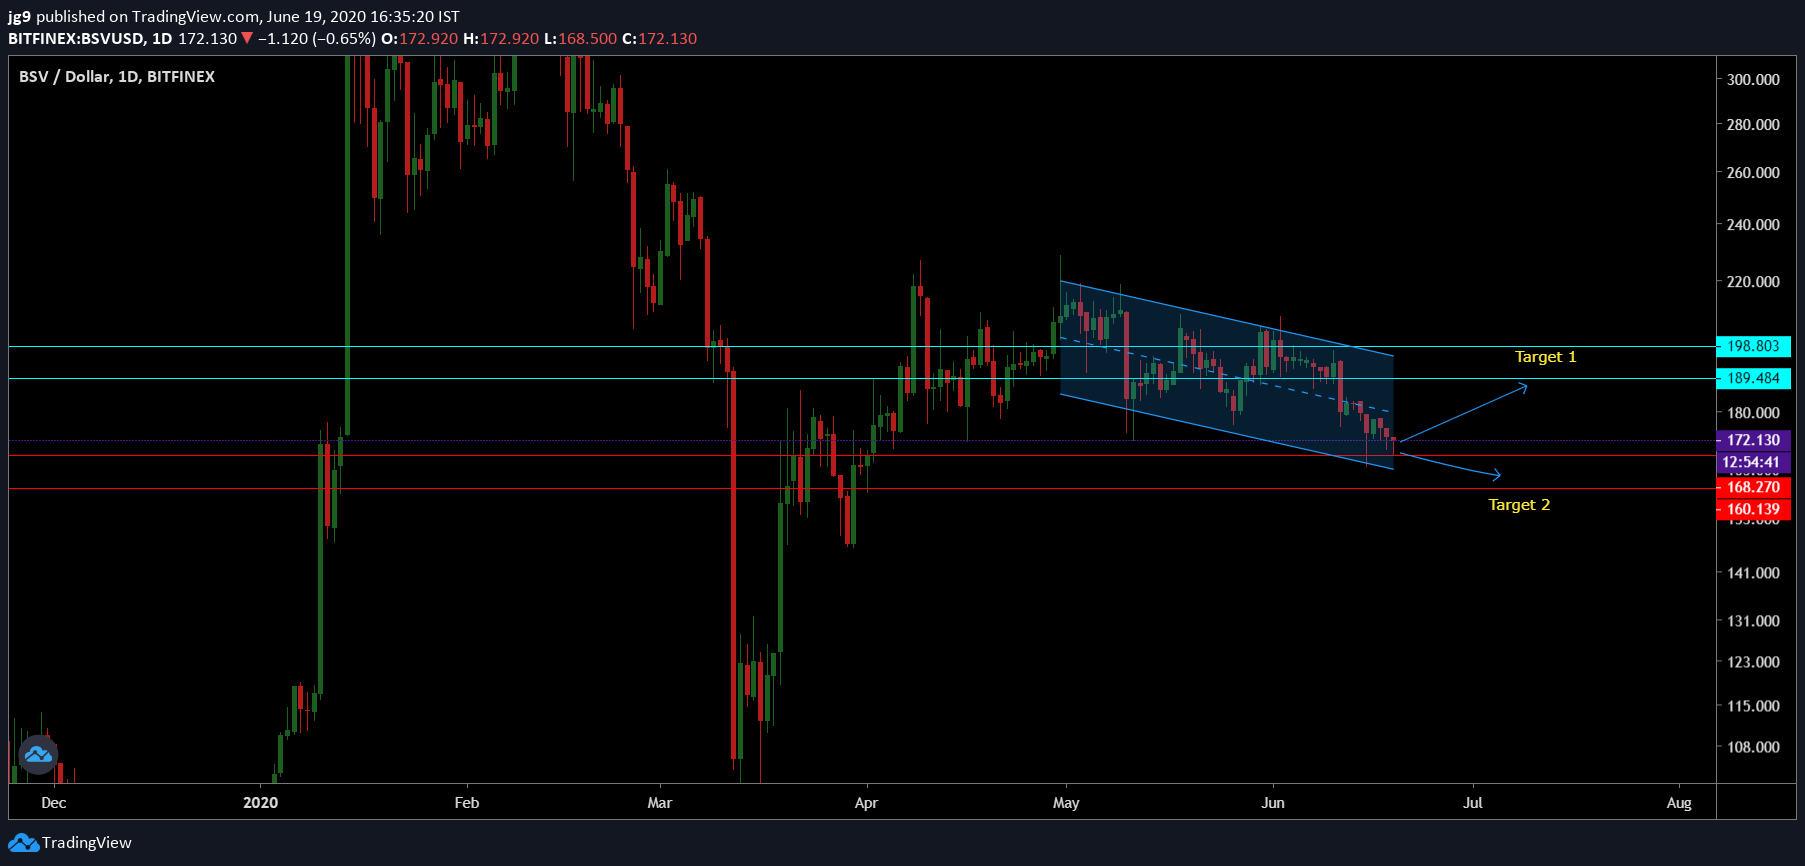
Source: BSV/USD, TradingView
According to the 1-day chart, Bitcoin SV’s price has been in a descending channel formation for over a month and is nearing a potential breakout. For BSV, if the price breaks out of the formation, the price may head upwards with a high chance of it moving towards its immediate resistance.
At press time, for Bitcoin SV, there is crucial support which it is currently testing the support at $168. The next resistance for the coin is $189 with another strong point of resistance at $198. When the price does break out of the formation, it is likely to head towards Target 1 over the next few weeks. If the bullish momentum fails to pick up the price may even head towards the second support at $160 in little over a week’s time.
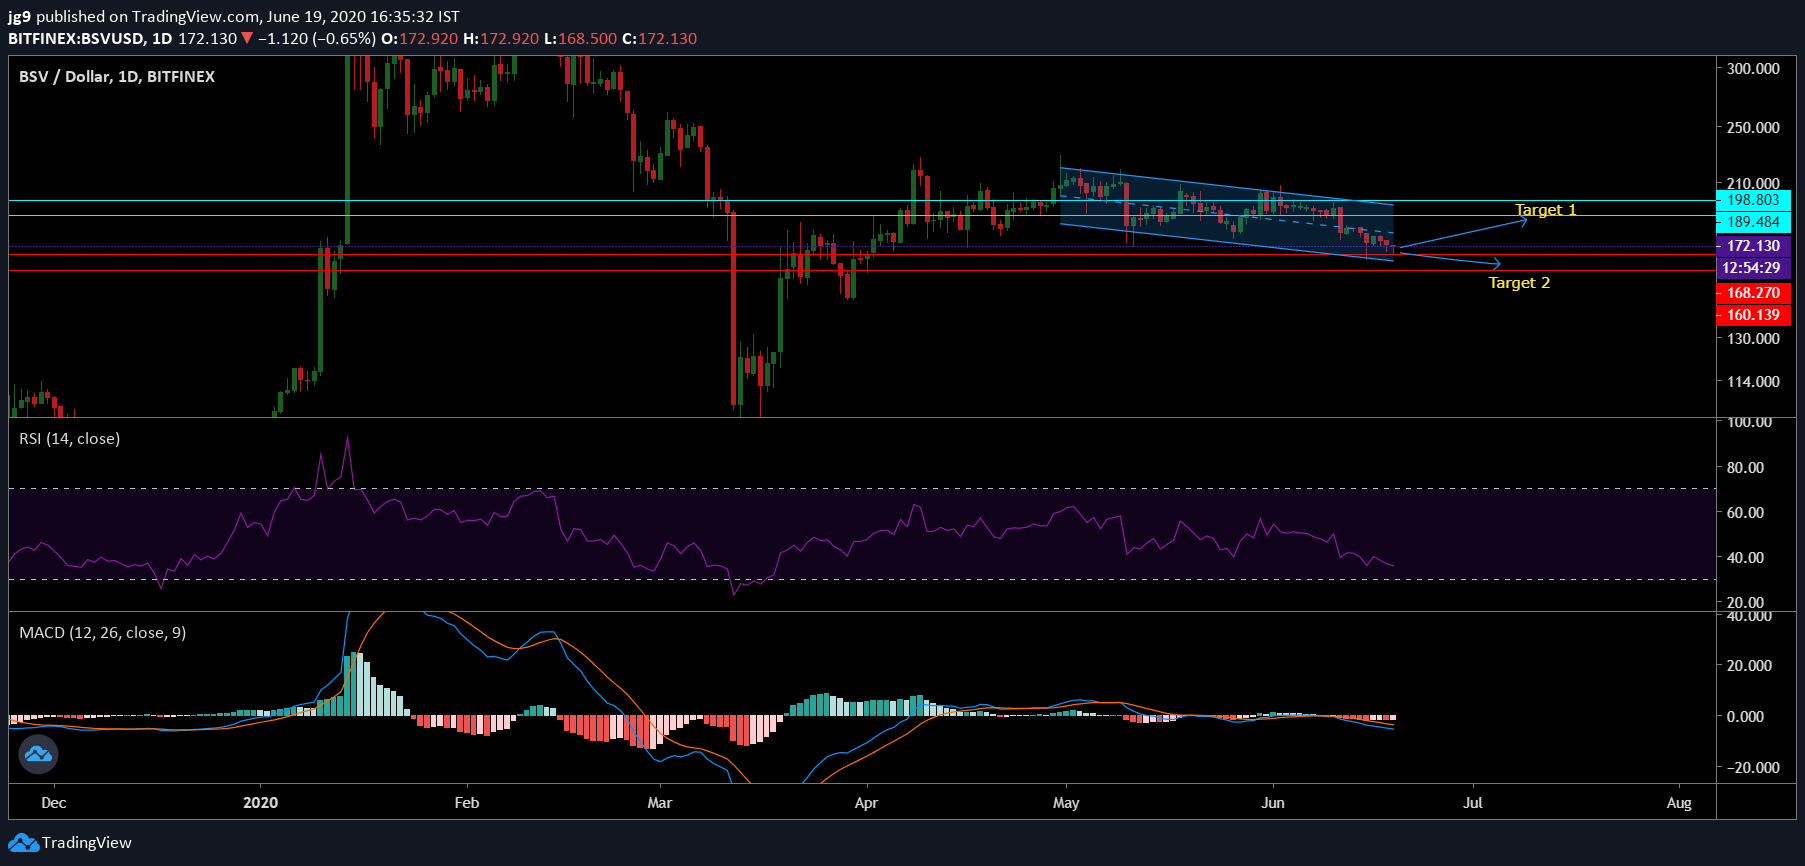 Source: BSV/USD, TradingView
According to BSV’s daily charts, the MACD indicator had undergone a bearish crossover, with the signal line going past the MACD line over a week ago. Further, the RSI indicator was heading towards the oversold zone.
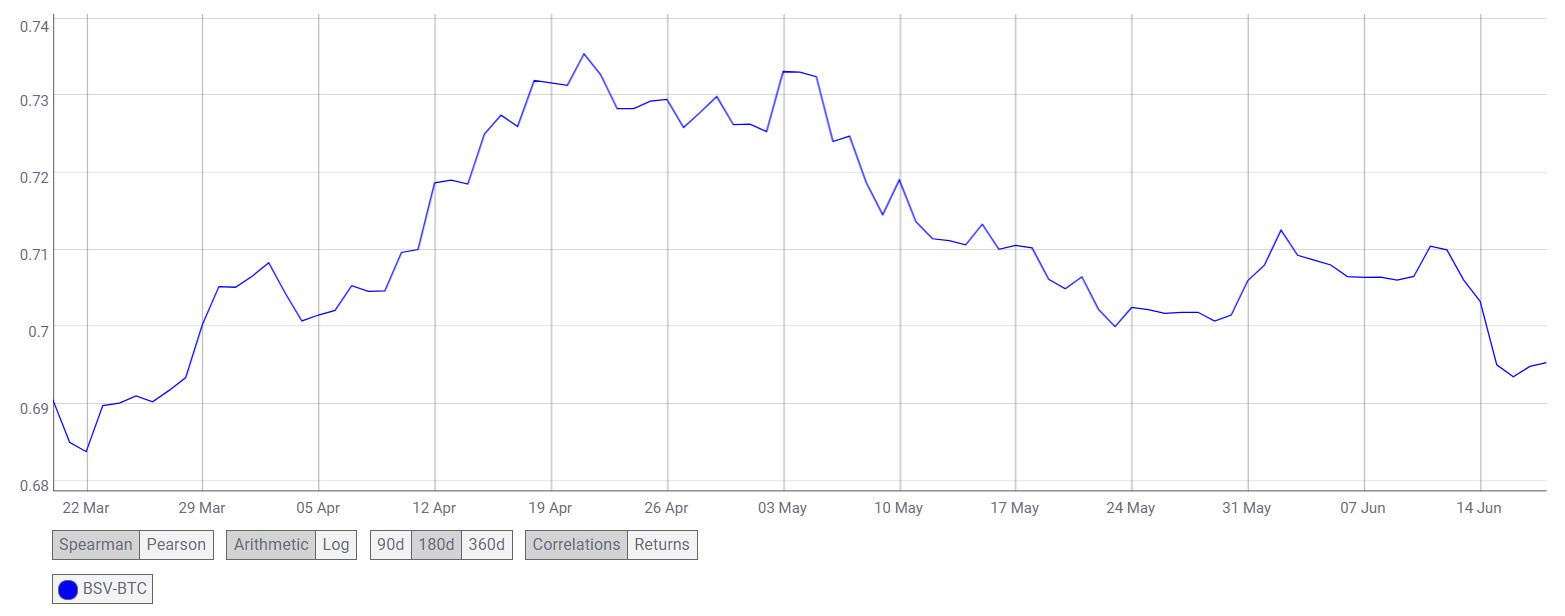
Source: CoinMetrics
Interestingly, Bitcoin SV’s correlation with the world’s largest cryptocurrency, Bitcoin, continued to gain momentum and has dropped significantly, with the correlation decreasing from 0.73 to 0.69 in over a month’s time.
Conclusion
Bitcoin SV has been in the descending channel for quite a while now and price breakout is likely to happen towards the early weeks of July. Taking into account the indicators and the probable price breakout, BSV is likely to reach Target 1 – $189 towards the end of the first week of July. However, if the bearish pressure continues to dominate BSV may move towards Target 2 – $160 over the same time frame.