Disclaimer: The findings of the following analysis foresee a change on the charts over the next week
Bitcoin SV’s steady decline since the start of June has come back to haunt the crypto-asset, with the high-performing Cardano having overtaken the Bitcoin fork to take the 6th place on the charts. While Bitcoin SV did register a bullish break on the 6th of July, within a day, it was back to its old ways and was falling on the charts again.
The token had a market cap of $3.16 billion with a decent 24-hour trading volume of $1.13 billion, at the time of writing.
Bitcoin SV 1-day chart
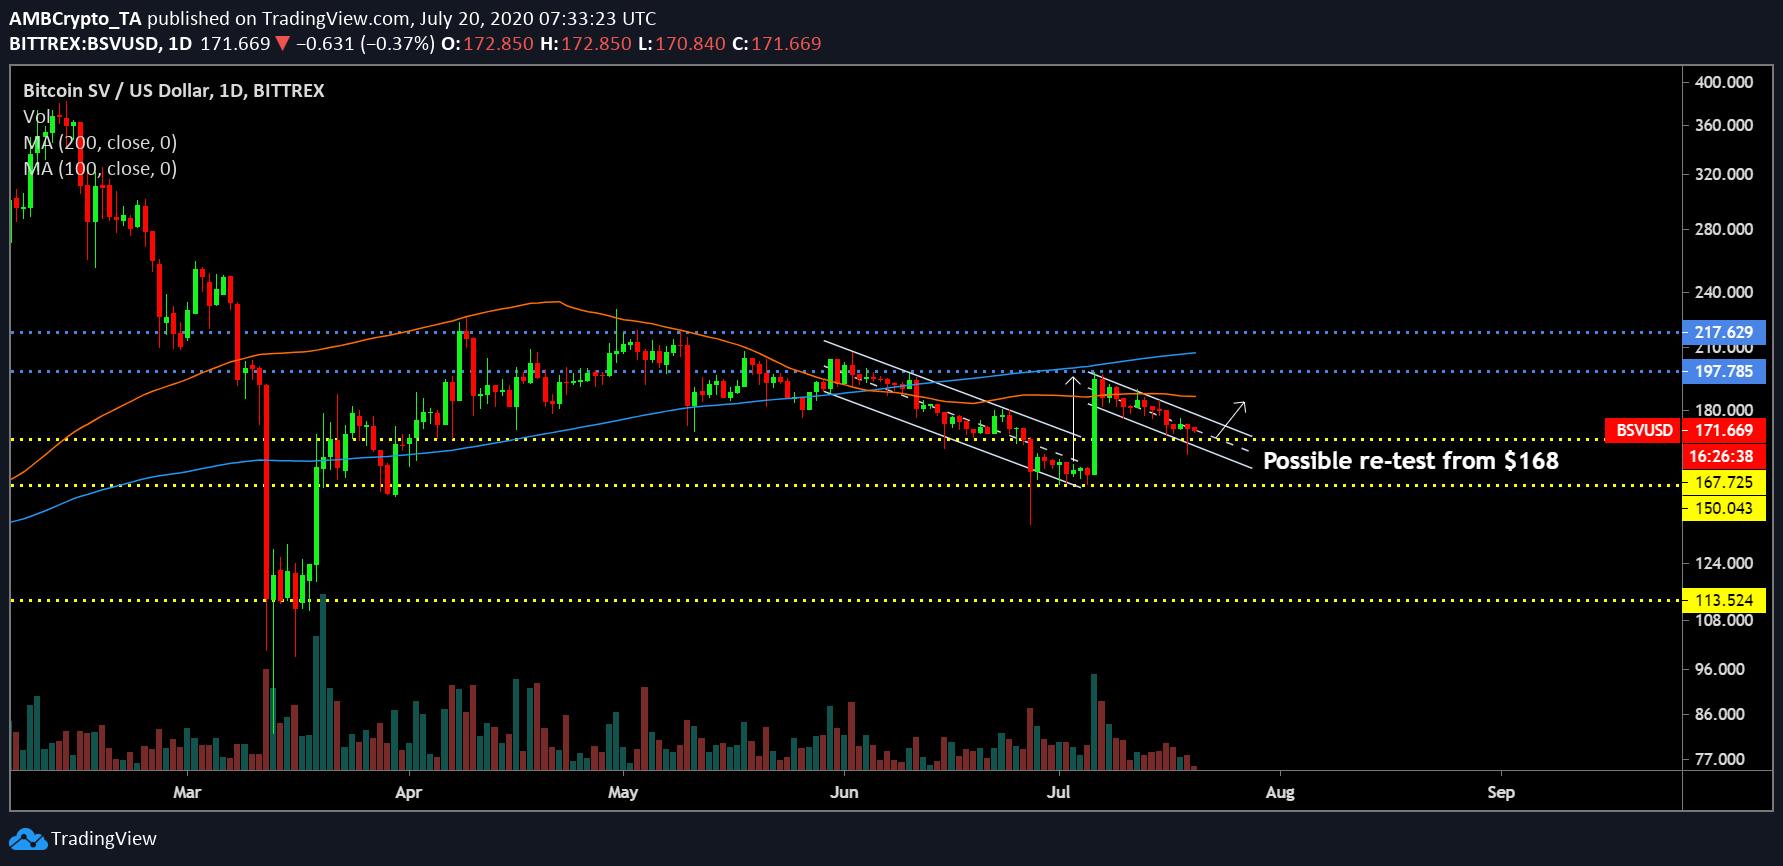
Source: BSV/USD on Trading View
The bull rally towards the end of March 2020 marked a turning point for various altcoins in the market, including the likes of Ethereum as they proved their credentials by surviving in a volatile market. Lesser-known assets such as Chainlink and Tezos also displayed persistence to recover at a staggering rate, but the same could not be said for Bitcoin SV.
The crypto-asset, at the time of writing, was yet to recover its losses from March’s collapse, with BSV seemingly mirroring its own declining movement over the past month.
As illustrated above, the latest breakout on 6 July came on the back of its month-long descending channel, and upon reaching its strong support, the crypto-asset registered a timely upwards breakout. However, the rally lasted only a day and since then, BSV has oscillated under a descending channel once again.
Right now, the immediate support at $168 may be re-tested, but the increasing selling pressure may push the crypto into visiting the $150 support line on the charts.
Source: BSV/USD on Trading View
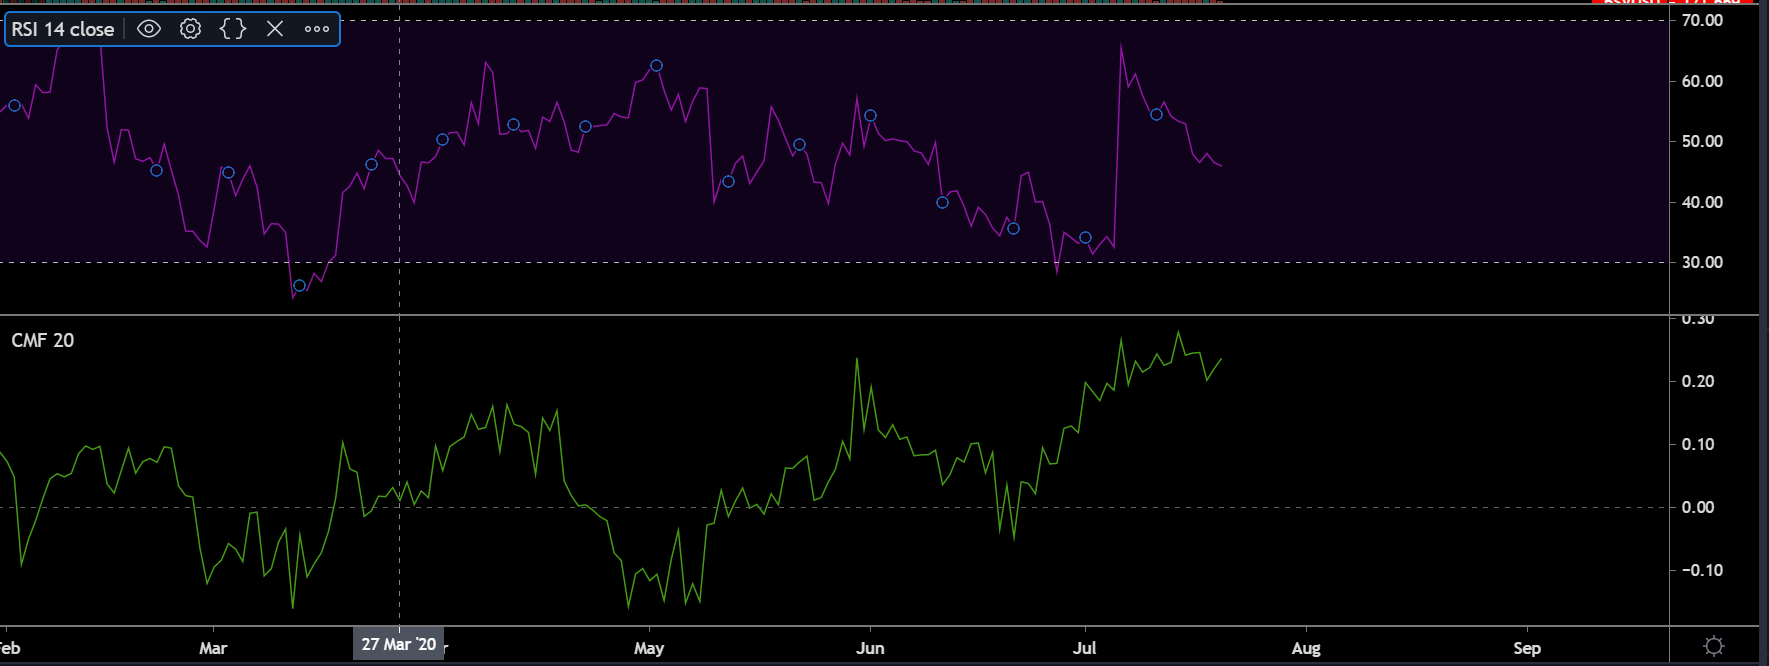
Interestingly, BSV’s market indicators seemed to be presenting contradictory pictures.
The Chaikin Money Flow or CMF suggested that the capital flowing into BSV was continuing to outperform the capital flowing out, a finding that opposed the trend noted by the RSI.
The Relative Strength Index implied that sellers were continuing to gain momentum, a development evident from a look at the crypto’s price movement on the charts.
Conclusion
A re-test at $168 is possible over the next week, with further correction down the line at $150 by the end of July or start of August.